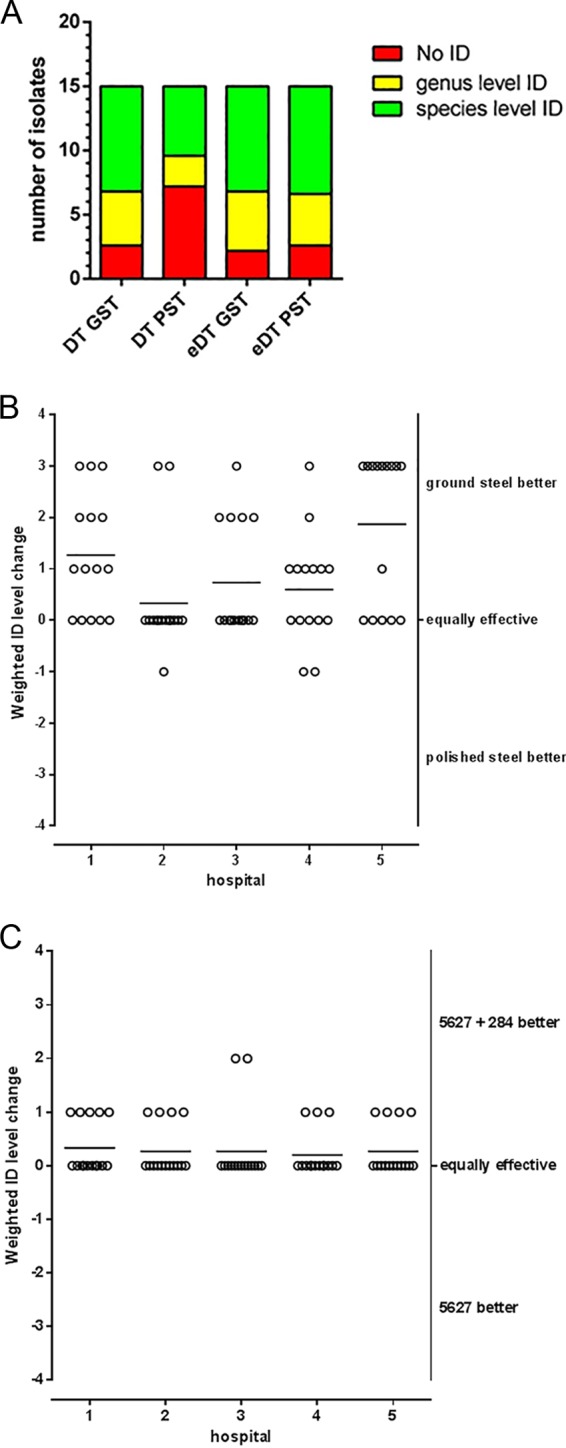
FIG 1.

(A) MALDI-TOF MS yeast identification using DT on GST is, on average, as effective as eDT on PST. Mean ID level frequencies for the 15 Candida isolates when tested by 5 independent laboratories are shown. Data are for target plate and method (x axis) versus the numbers of isolates with the indicated results (y axis). Green bars, score value of ≥2.000; yellow bars, score value between 1.700 and 1.999; red bars, score value of <1.7 or no peaks; GST, ground steel target; PST, polished steel target; DT, direct transfer; eDT, extended direct transfer (on-plate formic acid extraction; see reference 5 for details). (B) Yeast identification by MALDI-TOF MS using the commercial Bruker Daltonics database 5627 and DT performed better on GST than on PST in all 5 participating laboratories. Weighted ID level changes (for explanation, see the text) for the five independent laboratories (15 isolates per hospital) are shown. Data are for the hospital (x axis) versus the weighted change in ID level (y axis) per isolate (circles) on GST versus PST. Horizontal lines indicate the mean weighted change in ID level for the 15 isolates per hospital. (C) Database improvement resulted in improved MALDI-TOF MS identifications using DT on GST in all 5 participating laboratories (15 isolates per hospital). Weighted ID level changes (for explanation see the text) for the 5 independent laboratories are shown. Data are for the hospital (x axis) versus the weighted change in ID level (y axis) per isolate (circles) using database 5627 versus database 5627 plus 284 extra yeast MSPs (see the text). Horizontal lines indicate the mean weighted change in ID level for the 15 isolates per hospital.
