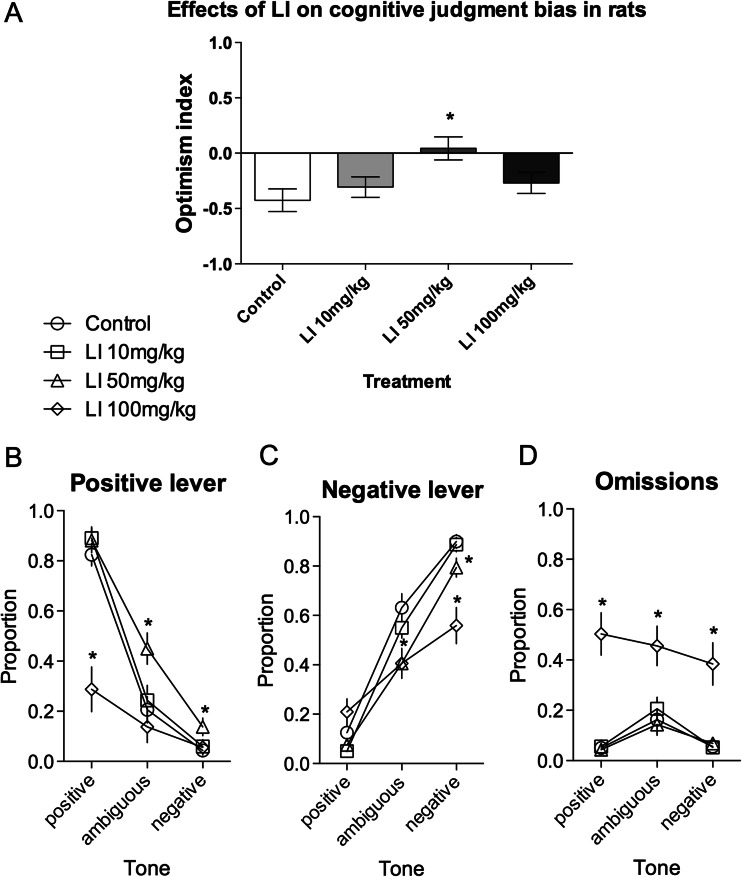
Fig. 2.
Effects of three different doses of LI on the judgment bias of rats in the ambiguous-cue interpretation test. a The mean ± SEM optimism index of the control (white bar) and LI 10 mg/kg (light grey bar), 50 mg/kg (grey bar), and 100 mg/kg (black bar) treated rats. The mean ± SEM proportion of b positive, c negative, and d omitted responses to the trained and ambiguous tones in the control (white circle) and LI 10 mg/kg (white square), 50 mg/kg (white triangle), and 100 mg/kg (white diamond) treated rats. Asterisk indicates significant (p < 0.05) differences between the control and LI treated animals. N = 16/group

