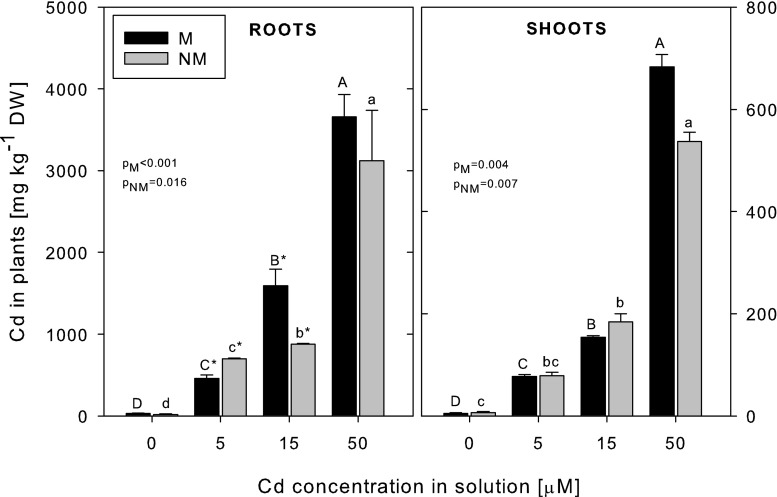
Fig. 1.
The concentrations of Cd in metallicolous (M) and nonmetallicolous (NM) plants of D. carthusianorum exposed to varying Cd concentrations for 14 days. Means ± SE. p values of Kruskal-Wallis analyses are given. The values followed by the same letters (upper case letters for M ecotype and lower case letters for NM ecotype) are not significantly different at p < 0.05. Asterisks indicate significant differences between the ecotypes at the same Cd treatments (p < 0.05)

