
Fig. 7.
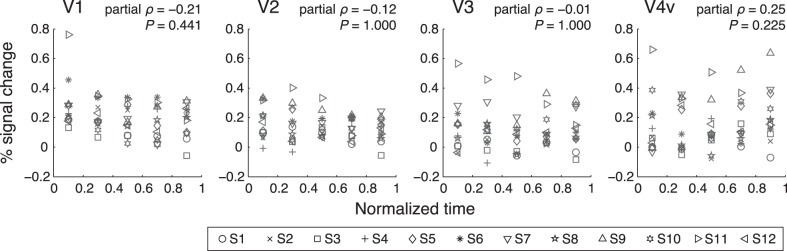
Response amplitudes to the invisible wedge as a function of timing of the invisible wedge onset. Horizontal axis represents normalized time in proportion to duration of given suppression period. Each symbol type represents the data of 1 subject (n = 12). Partial correlation analysis revealed no significant correlations between the response amplitudes and the relative onset timing, after removing the influence of the subject. Partial Spearman's correlation coefficients (ρ) and Bonferroni corrected P values are shown.