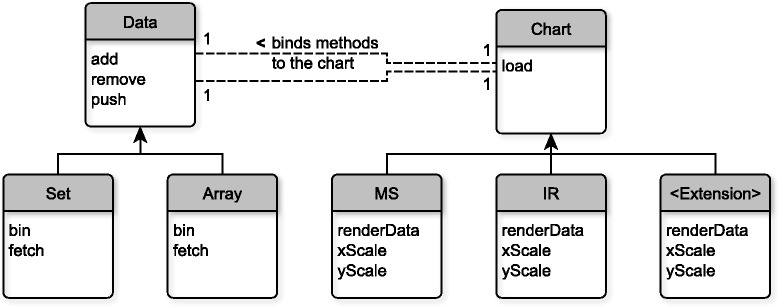
Figure 1.

Simplified diagram of the relationships between the data and chart structures and their extensions. This diagram illustrates the concept of how the data to be displayed and the chart type that displays the data are separated and how they can interact. Predefined or new custom data and chart structures extend their individual Data and Chart objects, i.e. they inherit a contract that defines how the data and chart structures can be accessed (black line). Data extensions need to provide a fetch and bin function that define how the data is retrieved from a resource and how it is binned whereas chart extensions need to define how the data is rendered (renderData) and how the x- and y-values are scaled (xScale, yScale). Depending on the function definitions, chart extensions can for example appear as MS charts or IR charts. In general, a chart extension can be written to represent many other types of two dimensional charts if the contract is fulfilled. When the data object is loaded to the chart object (dashed line), its add and remove methods are associated with the chart. Each chart can only have one data handle associated with it as indicated by the number ‘1’. The data object serves as data handle for all data-related interactions.
