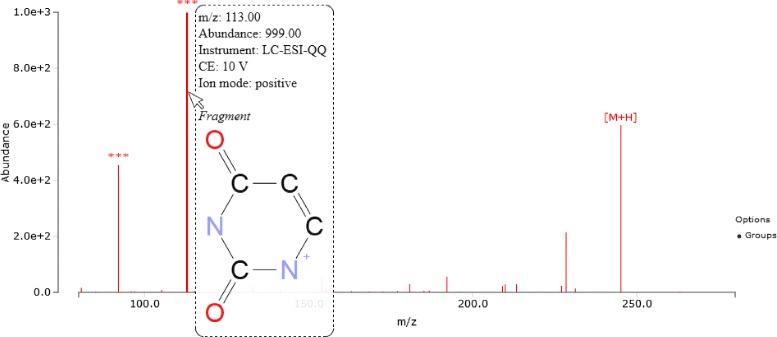
Figure 3.

Screenshot of the SpeckTackle viewer with annotations and tooltips. A fragmentation spectrum (MS2) of Uridine [MTBLC16704] is shown. Annotations are displayed for the main peak and two fragments. Tooltips for individual signals are loaded on mouse over. The putative fragment structure plus additional textual information is shown for the signal at m/z =113.00.
