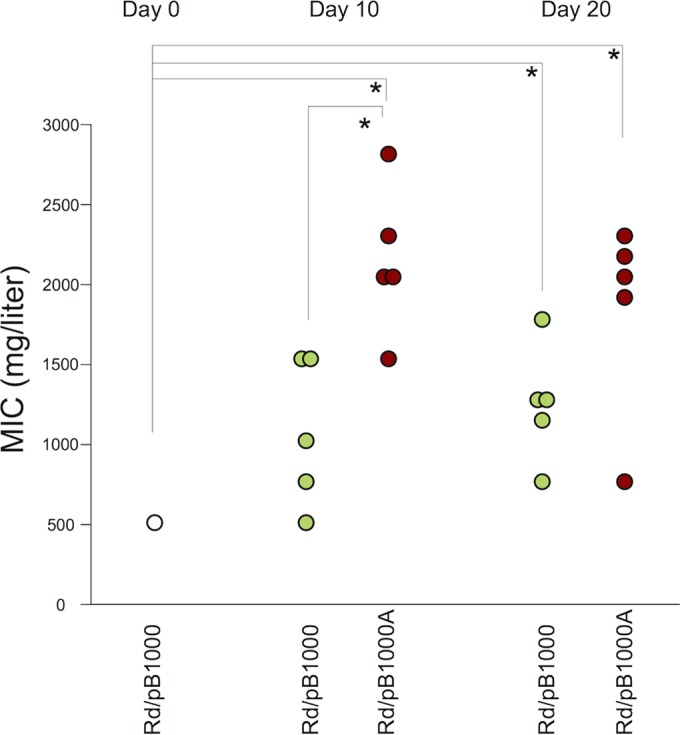
FIG 2.

Evolution of antibiotic resistance level. The MICs (mg/liter) of ampicillin in the different populations at days 0, 10, and 20 are shown. The white circle represents the MIC of the parental H. influenzae Rd KW20 carrying plasmid pB1000. The green circles represent the MICs of the five populations of Rd/pB1000 (propagated in the absence of ampicillin), and the red circles indicate the MICs of the five populations of Rd/pB1000A (evolved for 10 days with ampicillin and 10 further days without ampicillin). Asterisks denote significant differences (P < 0.05).
