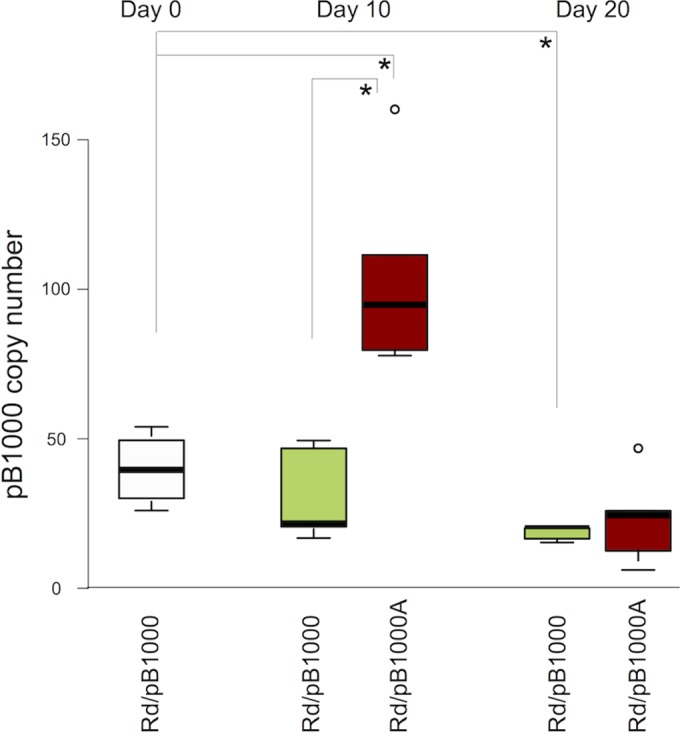
FIG 3.

Modification of the copy numbers of plasmid pB1000 over time. A graphic representation of the distribution of plasmid copy numbers at days 0, 10, and 20 is shown. The line inside the box marks the median. The upper and lower hinges correspond to the 25th and 75th percentiles. The upper and lower whiskers extend to the highest and lowest values. The outliers are plotted separately as circles on the chart. The white box represents the pB1000 copy number in the parental Rd/pB1000. The red boxes indicate the pB1000 copy numbers in the five populations of Rd/pB1000A (evolved for 10 days with ampicillin and 10 further days without ampicillin), and the green boxes indicate the pB1000 copy numbers in the five populations of Rd/pB1000 (propagated in the absence of ampicillin). Asterisks denote significant differences (P < 0.05).
