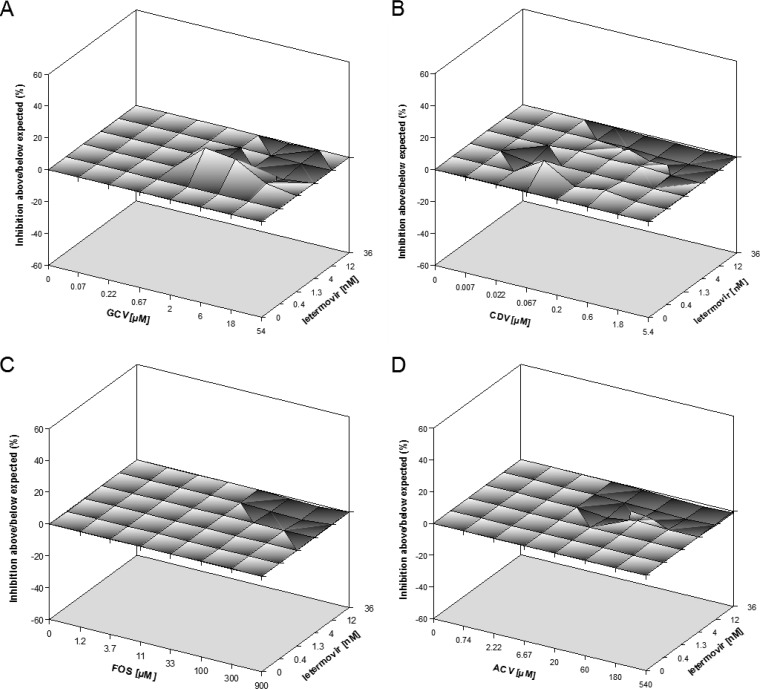
FIG 2.
Efficacy analysis of two-drug combinations by use of the Bliss independence model. Three-dimensional surface plots of the anti-HCMV activities of the indicated two-drug combinations are shown. Indicated are representative single-experiment plots of the combinations of letermovir and GCV (A), CDV (B), FOS (C), and ACV (D). The plots were generated using MacSynergy II software (33). The x and y axes show drug concentrations. The zero plane across the z axis represents the theoretical additive effect; a positive value, displayed as a peak above the plane, indicates synergy, and a negative value, shown as a valley below the plane, indicates antagonism. Each experimental data point represents the average of five cell culture replicates, and 95% confidence intervals were used to evaluate the data.

