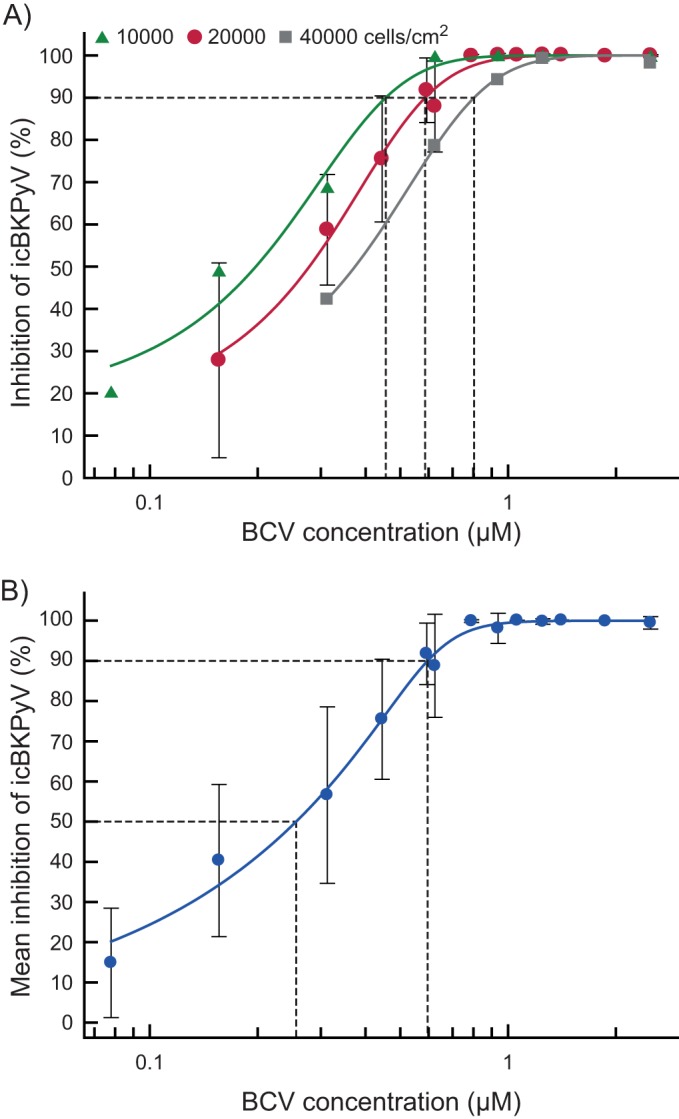
FIG 2.

Calculation of the 50% and 90% effective concentrations (EC50 and EC90) of BCV. (A) Effect of cell density on the EC90. Cells were seeded at 10,000, 20,000, and 40,000 cells/cm2 and infected 24 h later with purified BKPyV at 2 FFU/cell. Infected cells, treated with various concentrations of BCV 2 hpi, were harvested 72 hpi (70 hpt), and the icBKPyV was measured by qPCR. Each dilution was tested between 2 and 12 times in independent experiments with 2 or 3 replicates, each of which was amplified in triplicate, giving between 12 and 63 individual quantification results per point in the plot. The mean percent inhibition of the icBKPyV is plotted against the BCV concentration. The value for medium containing only buffer was set as 0% inhibition, and that for the input viral load was set as 100% inhibition. Dotted vertical lines indicate the EC90 values resulting from the different cell densities. The error bars shown represent standard deviations of the mean percent inhibition between experiments carried out with 20,000 cell/cm2 are shown. Error bars for other cell densities were excluded for clarity. (B) Combined titration results at all three cell densities presented in panel A. As described above, the mean percent inhibition of the icBKPyV is plotted against the BCV concentration. The value for medium containing only buffer was set as 0% inhibition, and that for the input viral load was set as 100% inhibition. Error bars indicate the standard deviations of means between experiments. The EC50 and EC90 are indicated by dotted lines.
