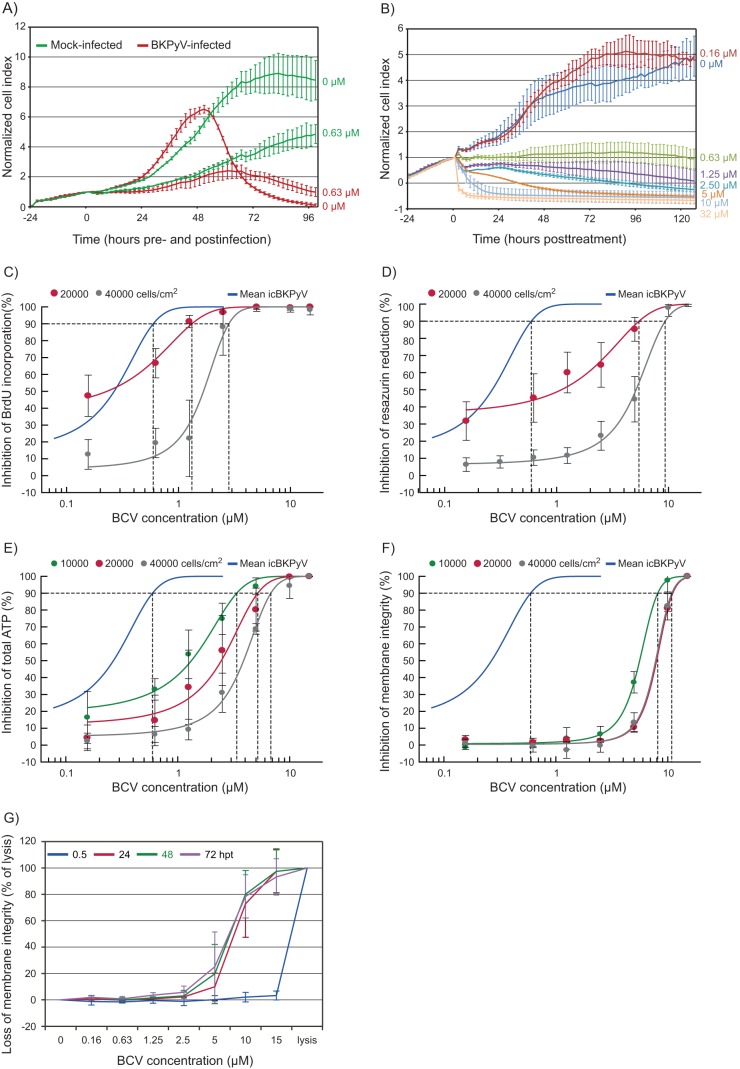
FIG 5.
Cytostatic and cytotoxic effects of BCV. (A and B) Concentration-dependent temporal effects of BCV on the cell index (a measure of electrical impedance) in infected and mock-infected HUCs. HUCs were seeded and incubated for 24 h prior to either infection with purified BKPyV at 5 FFU/cell or mock infection and simultaneous treatment with BCV or buffer only. Electrical impedance in cell culture monolayers was measured using the xCELLigence system from seeding, 24 h before infection, until 96 to 120 hpi/hpt. Cell index was normalized at the point of infection/treatment. Experiments were repeated 7 times in triplicate, and results of a representative experiment are presented. (A) Comparison of cell index for infected and mock-infected, BCV- and buffer-only-treated HUCs seeded at 60,000 cells/cm2. (B) Temporal effects of increasing concentrations of BCV on the cell index of mock-infected HUCs seeded at 30,000 cells/cm2. (C, D, E, and F) Concentration-dependent effects of BCV on viability of HUCs in endpoint assays. Inhibition of cellular DNA replication (BrdU incorporation assay) (C) and inhibition of mitochondrial activity (resazurin reduction assay) (D) both at 20,000 (red) and 40,000 (gray) cells/cm2, as well as inhibition of total ATP levels (CellTiter-Glo luminescent cell viability assay) (E) and loss of membrane integrity (CellTox Green cytotoxicity assay) (F) both at 10,000 (green), 20,000 (red), and 40,000 (gray) cells/cm2, are shown. The curve for inhibition of icBKPyV (blue) is included for reference. Dotted lines indicate EC90 and CC90. All viability measurements were performed at 72 hpt in uninfected HUCs. Mean values from 3 experiments carried out with 6 parallels are presented. Error bars represent standard deviations between experiments. (G) Daily measurement of the loss of membrane integrity in uninfected HUCs with increasing concentrations of BCV. Cells were seeded at 20,000 cells/cm2 and incubated for 24 h before addition of CellTox Green cyanine dye and treatment with the indicated concentrations of BCV, buffer only, or lysis buffer. Fluorescence, indicating nuclear penetration and binding to the DNA by the cyanine dye, was recorded at 0.5, 24, 48, and 72 hpt. Mean values from 3 experiments carried out with 6 parallels are presented. Error bars represent standard deviations between experiments.

