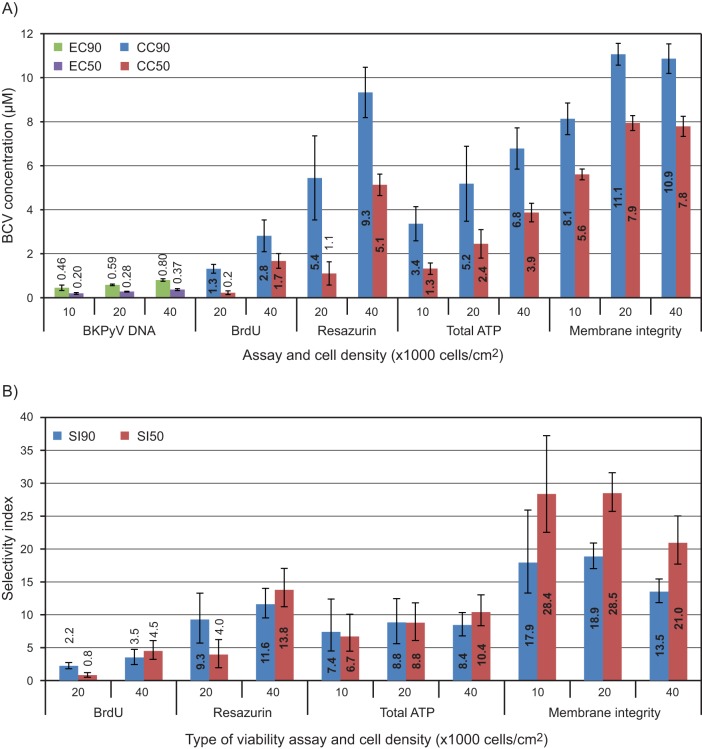
FIG 6.
Graphic representation of the selectivity profile of BCV for inhibition of BKPyV in HUCs. (A) EC90, EC50, CC90, and CC50 of BCV. (B) SI50 and SI90. The icBKPyV and endpoint viability were measured at 72 hpi/hpt. EC90 and CC90 values and their 95% confidence intervals were calculated using the curve-fitting software XLfit with a 4-parameter logistic model (model 208). Selectivity indices were calculated by dividing CC by EC. Confidence intervals for selectivity indices were calculated as follows: lower limit = (CCx – 95% CI)/(ECx + 95% CI); upper limit = (CCx + 95% CI)/(ECx – 95% CI).

