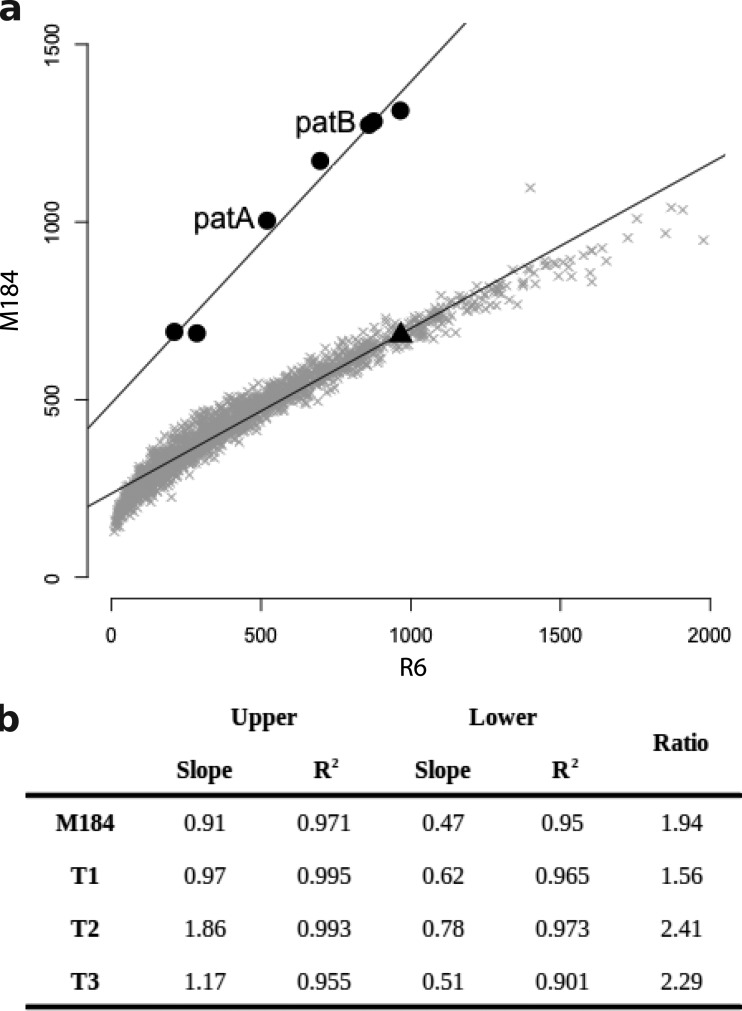
FIG 3.
Evidence of duplication of a genomic region, including patA and patB, from comparison of per gene normalized read depths. (a) Per gene RPKM values for M184 plotted against those for R6. Six genes (filled circles) appeared to be present at a higher copy number than the remaining genes (gray crosses) in M184 than in R6. On further inspection, these genes were contiguous and included patA and patB (indicated). The hexA gene immediately upstream of patA (filled triangle) was not included in the higher-copy-number region. (b) The same six genes were present at increased copy numbers in M184 and the three R6M184 transformants (T1 to T3). The slope of the regression line calculated for the high-copy-number genes (upper) was divided by the slope of the regression line for the remainder of the genome (lower) to obtain an estimate of the copy number of the amplified genes.

