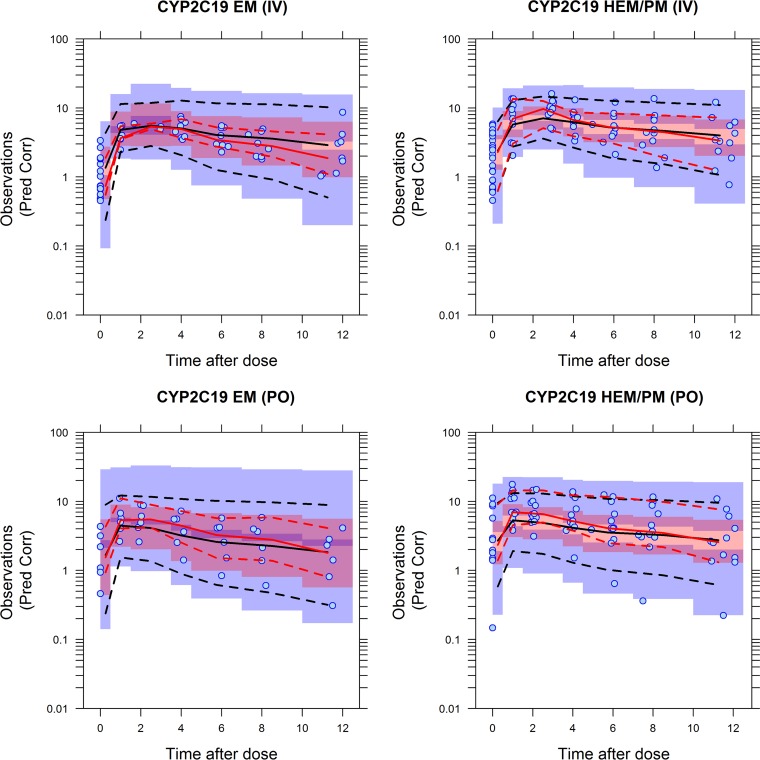
FIG 1.
pcVPC with observed and simulated voriconazole median and 10th and 90th percentile prediction-corrected (Pred Corr) concentrations and 80% prediction interval stratified by CYP2C19 genotype status. The symbols are observed data. The black solid and dashed lines and red solid and dashed lines represent the medians and 10th and 90th percentiles of the simulated and observed voriconazole concentrations, respectively. The bands around the simulated percentiles represent the 95% confidence intervals of the simulated concentrations.

