
FIG 4.
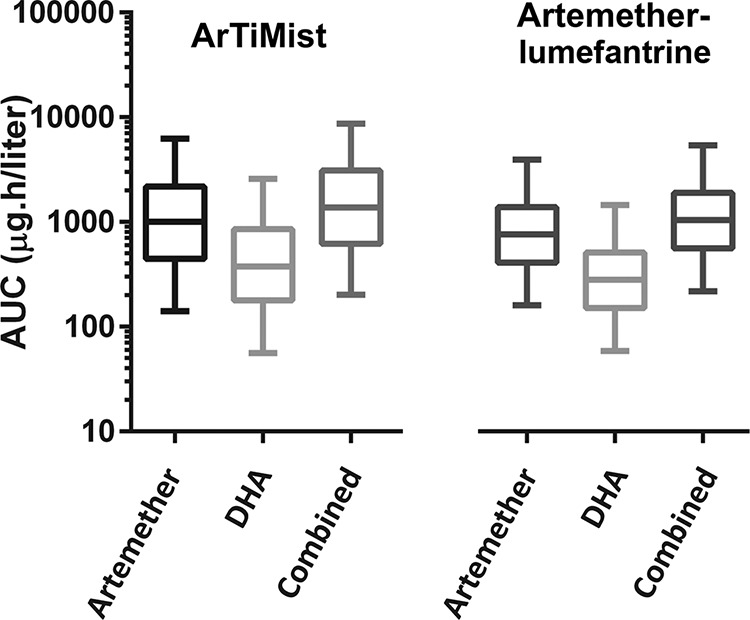
Results of the simulation study presented as box-and-whisker plots demonstrating the 90% prediction intervals for artemether AUCs, dihydroartemisinin (DHA) AUCs, and combined AUCs after the first doses of ArTiMist and artemether-lumefantrine tablets. The horizontal line in each box represents the median and the box indicates the interquartile range within each 95% prediction interval (vertical lines).