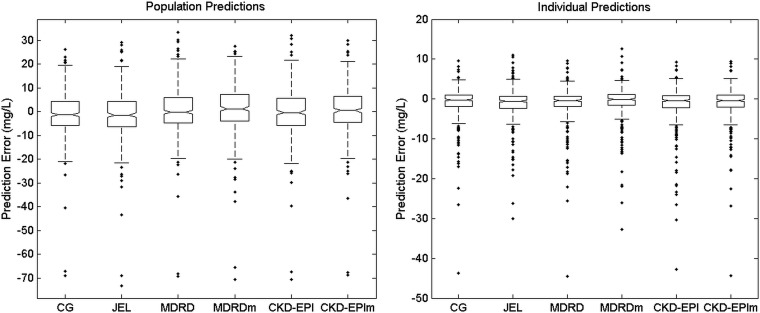
FIG 1.
Box plots of prediction errors from the six vancomycin models. For each box, the central marker is the median, and the edges of the box are the 25th and 75th percentiles. The whisker length is 1.5 times the interquartile range. Dots represent outlier values. The left panel shows population predictions; the right panel shows individual predictions. For individual predictions, two outlier values less than −50 mg/liter are not shown, for ease of graphical display.

