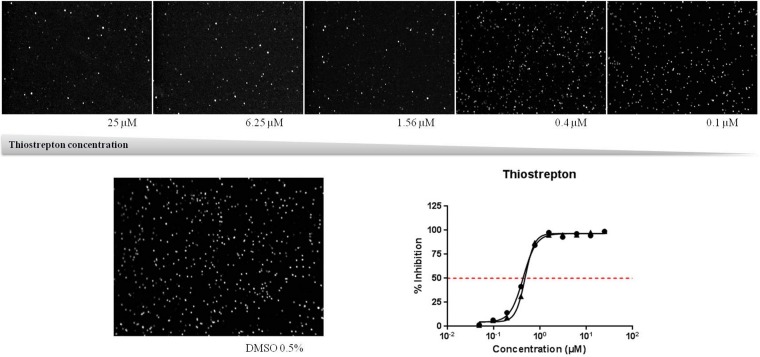
FIG 1.
HTS pharmacology validation. (Bottom right) Graphical representation of thiostrepton dose-response curve; (top and bottom left) Cy3 signal of activated female gametocytes after 48 h treatment with thiostrepton (top) or DMSO (bottom left) control. A 10× objective was used to obtain the images.

