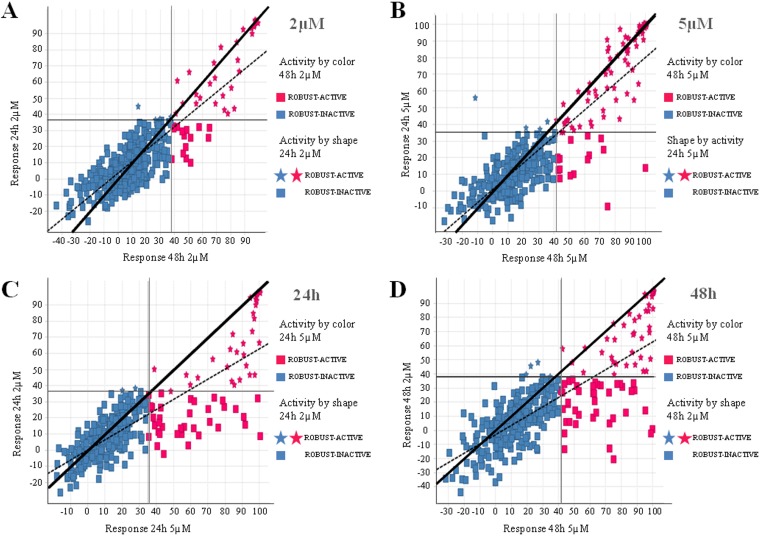
FIG 4.
Determination of the best screening conditions: graphical representations of the robustness of test results. Pairwise comparisons of incubation times (24 and 48 h) and compound concentrations (2 and 5 µM) are provided. (A and B) Response of increasing incubation time; (C and D) response of increasing concentration. Blue squares, compounds inactive under both conditions; pink stars, compounds active under both conditions; pink squares and blue stars, compounds active when the incubation time or concentration was increased.

