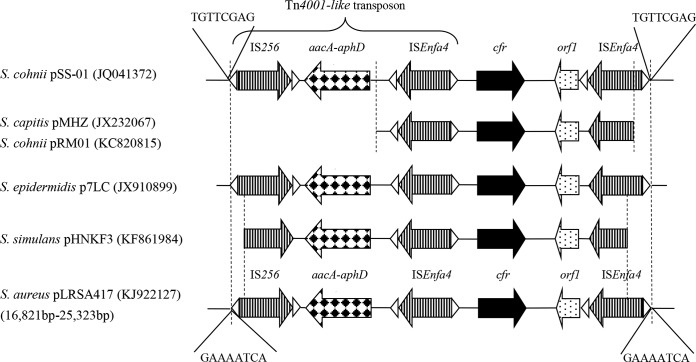
FIG 2.
Schematic representation and comparison of the cfr genetic environment. Linear genetic maps of plasmids are presented, with the accession numbers given in parentheses. Genes and their corresponding transcription orientations are indicated by arrows with various shading patterns. The region within the two dotted lines between plasmid maps illustrates that they share high homology (>95% nucleotide identity). The structure of a Tn4001-like transposon is indicated. The triangles represent the inverted repeats of the respective mobile elements, and target site duplications are presented as 8-bp sequences.

