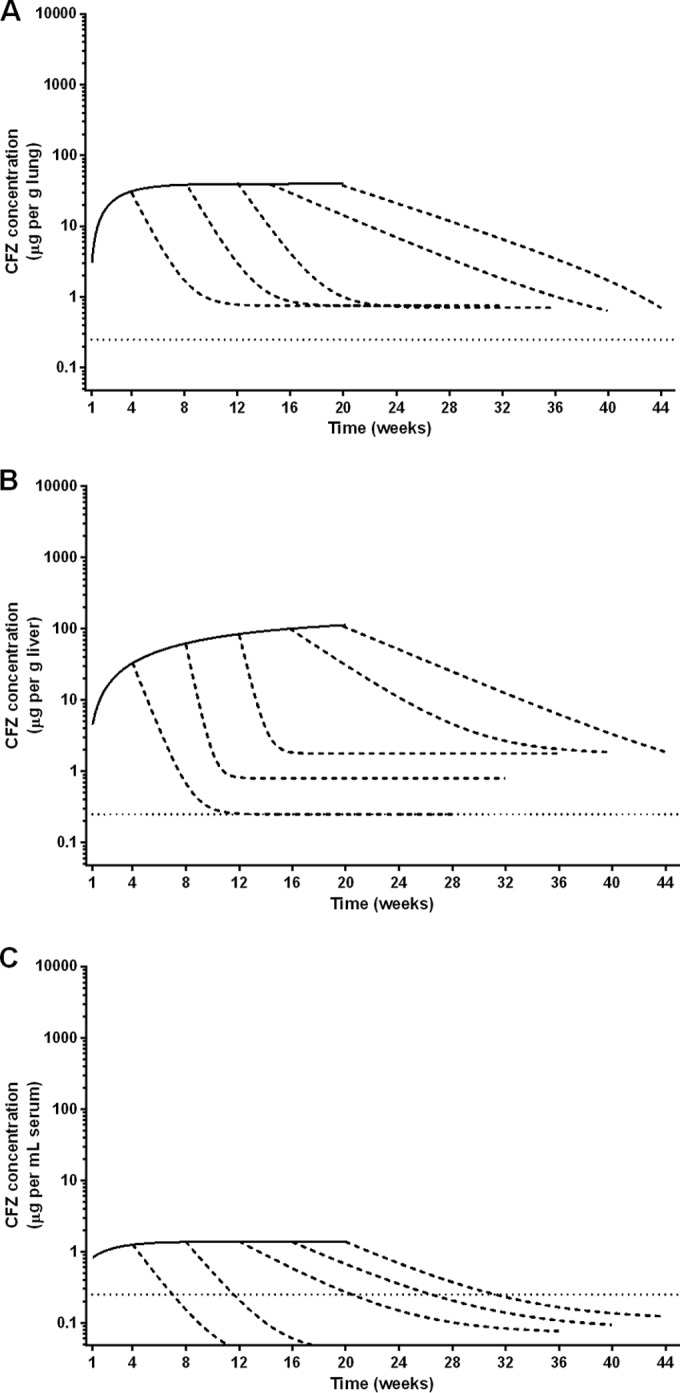
FIG 2.

Nonlinear regression of clofazimine accumulation and elimination in the lungs (A), liver (B), and serum (C) of uninfected BALB/c mice. Elimination curves are included for each group of mice that discontinued clofazimine administration after 4, 8, 12, 16, and 20 weeks. Clofazimine concentration data for the lungs, liver, and serum are presented in Tables S3, S4, and S5 in the supplemental material, respectively. The dotted lines represent the MIC of clofazimine for M. tuberculosis.
