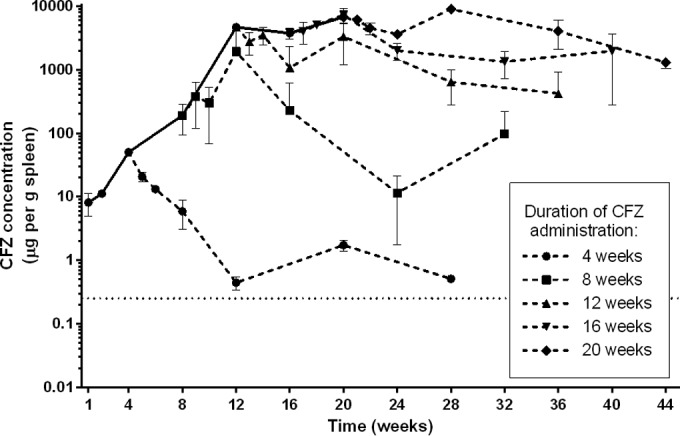
FIG 3.

Clofazimine accumulation and elimination in the spleens of uninfected BALB/c mice. The concentrations of clofazimine measured after stopping administration are represented by the dashed lines. The error bars represent standard deviations (3 mice per group per time point). Clofazimine concentration values are presented in Table S6 in the supplemental material. The dotted line represents the MIC of clofazimine for M. tuberculosis.
