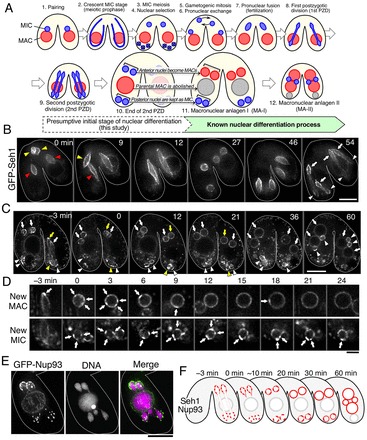
Fig. 1.

Dynamic behaviors of GFP-tagged common Nups in conjugating Tetrahymena cells. (A) Schematic representation of nuclear events during sexual reproduction. MICs and MACs are drawn in blue and red, respectively. Crescent MICs and post-zygotic nuclei undergo meiosis and mitosis, respectively. The nuclear envelope of these nuclei does not breakdown in meiotic and mitotic divisions. Parental (old) MACs (gray) are resorbed during nuclear differentiation (see also supplementary material Movie 1). (B) Typical time-lapse images of a conjugating pair of cells expressing GFP–Seh1 at stages from pronuclear exchange to the second PZD (cell numbers observed, n = 6 pairs). A set of 3D images (17 z-stacks×1.5 µm intervals) was taken every 3 min. The 3D images were projected after deconvolution and the images of the selected time points are shown (see also supplementary material Fig. S1). Yellow and red arrowheads indicate migratory and stationary pronuclei, respectively. White arrows and arrowheads indicate anterior and posterior regions, respectively, of dividing zygotic nuclei during the second PZD. The numbers represent the time in minutes after the start of observation. Scale bar: 10 µm. (C) Typical time-lapse images at stages from the second PZD to MA-II (in A) (n = 19 pairs). Images were taken as described in B except that 3D images (18 z-stacks×1.0 µm intervals) for each time point were taken. Arrows and arrowheads indicate presumptive new MACs and MICs, respectively. Yellow symbols indicate nuclei whose enlarged images are shown in D. Time 0 represents the time after the end of the second PZD. Scale bar: 10 µm. (D) Magnified views of the presumptive new MAC and MIC indicated by yellow symbols in C. Arrows indicate regions with strong fluorescence signals on the NE. Scale bar: 3 µm. (E) A conjugating pair of cells expressing GFP–Nup93 fixed at anaphase of the second PZD (n = 19 pairs). Upper- and lower sides are the anterior and the posterior regions of the cell, respectively. Scale bar: 10 µm. (F) Schematic diagram of the distribution of common Nup's (red). Time represents the time after the end of the second PZD.
