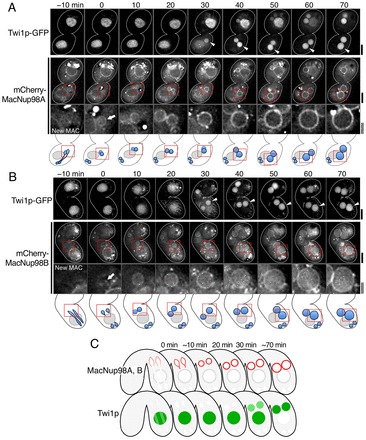
Fig. 2.

Dynamic behavior of MAC-specific Nup98s during nuclear differentiation. (A) Time-lapse images of a conjugating pair of cells expressing mCherry–MacNup98A and Twi1p–GFP from the second PZD (stage 9 in Fig. 1A) to MA-I (stage 11 in Fig. 1A) (n = 6 pairs). 3D images (28 z-stacks×0.5 µm intervals) were taken every 10 min. The images were processed by reducing background noise and deconvolution. Single focal plane images at the selected time points are shown. Time 0 represents the end of the second PZD. Arrowheads indicate one of the new MACs in which Twi1p–GFP signals appear. Enlarged views of this nucleus are shown in the lower panels. An arrow indicates the anterior nucleus immediately after fluorescence signals of mCherry–MacNup98A start to appear. Scale bars: 10 µm (thick line) and 3 µm (double lines). The magnified regions are the boxed areas in the middle panels and the schematic illustration shown immediately below A. (B) Same as A, except that cells expressing mCherry–MacNup98B, instead of mCherry–MacNup98A, were used and 3D images (32 z-stacks×0.5 µm intervals) were taken (n = 6 pairs). (C) Schematic diagram of the distribution of MAC-specific Nup98 nucleoporins (red) and Twi1p (green). Time represents the time after the end of the second PZD.
