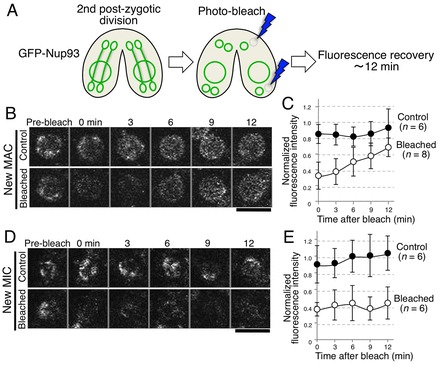
Fig. 4.

FRAP analysis during early nuclear differentiation reveals de novo NPC assembly in the anterior new MAC but not in the posterior new MIC. (A) Schematic diagram of this experiment. The stages were monitored by time-lapse observation of GFP–Nup93. At the end of the second PZD, GFP–Nup93 fluorescence in a single nucleus located in the anterior (B,C) or posterior (D,E) region was photobleached, and its recovery monitored for 12 min. (B) A typical example of images for the anterior nucleus (new MAC) is shown. Images of the unbleached nucleus in the same pair are shown as a control. Scale bars: 3 µm. (C) The data of fluorescence recovery were quantified, and the average values obtained from n (as indicated) independent experiments are shown. Errors bars indicate standard deviation. (D,E) Same as B and C, except that results for the posterior nucleus (new MIC) are shown, instead of those for the anterior nucleus.
