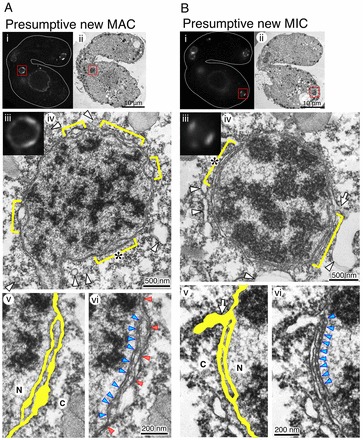
Fig. 5.

Redundant NE and NPC clusters found in differentiating nuclei. Live CLEM was used to observe the ultrastructure of differentiating nuclei; a conjugating pair of cells expressing GFP–Nup93 was monitored using time-lapse imaging, and fixed when the cells reached the end of the second PZD. The fixed specimen was then subjected to electron microscopy. (A) Images of an anterior nucleus (presumptive new MAC). (B) Images of a posterior nucleus (presumptive new MIC). (A,B) (i) A single-section image from the fluorescence z-stack of images is shown with a focus on the objective nucleus (boxed red area). (ii) A single-section electron micrograph correlating with the fluorescence image shown in i. (iii) A magnified view of the boxed region in i. (iv) A magnified view of the boxed region in ii. Yellow brackets indicate the regions where NE redundancy is observed. Arrowheads indicate membrane structures near the nucleus. A position where the outer membrane of the NE fuses to another membrane is indicated by an arrow. Asterisks indicate the region where the enlarged view is shown in v and vi. (v, vi) Duplicate images of a magnified view of the region indicated by the asterisk in iv. Yellow areas in v represent the structure of the redundant NE shown in vi. N, nucleoplasm; C, cytoplasm. The arrow in panel v of B indicates a vacuole fusing to the edge of the redundant region. In vi, the positions of the NPCs clustered in the inner (nucleoplasmic side) NE of the redundant NE region are indicated by blue arrowheads, and the NPCs facing the outer (cytoplasm side) NE are indicated by red arrowheads. See also supplementary material Fig. S3A–G.
