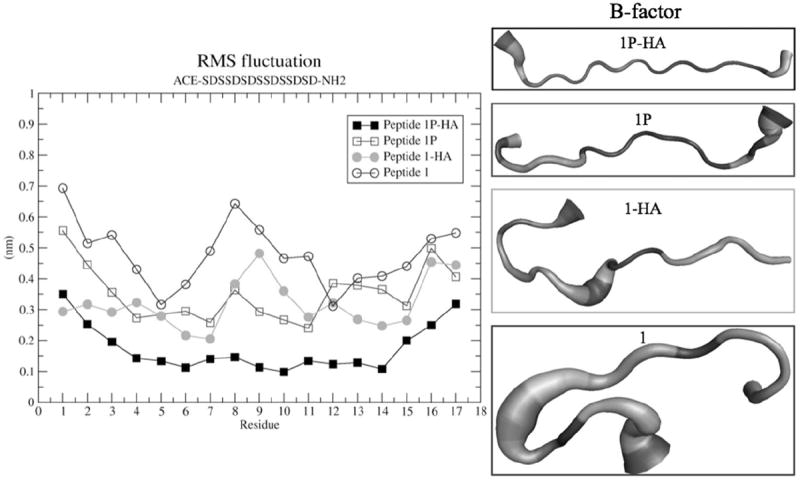
Figure 2.

Root mean square fluctuation plot (RMSF plot) calculated for all individual residues for phosphorylated peptide (peptide 1P-HA and peptide 1P) and unphosphorylated peptide (Peptide 1 and Peptide 1-HA). The B-factor analysis showed the average structures.
