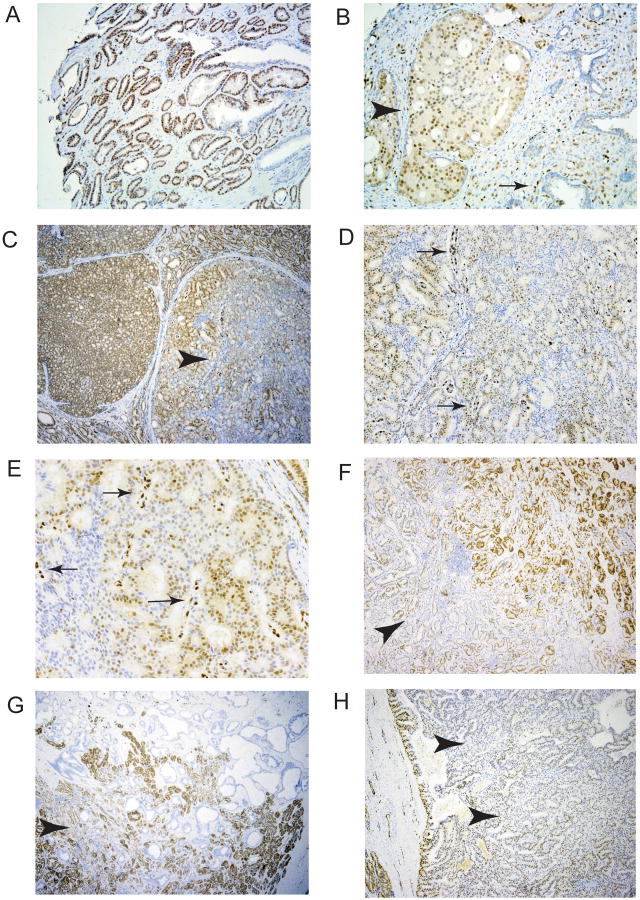
Figure 1. Immunohistochemical analysis of ERG expression in prostate cancers.
A, B. ERG expression in a tissue microarray. Some cancers showed uniform strong expression (A, 40×) while other cancers on the same tissue microarray slide showed distinctly lower overall staining, and in some cases substantial intrafocal variability (B, 100×), Arrowhead indicates a cribiform tumor nodule with variable ERG staining. Arrow shows ERG staining in endothelial cells which are uniformly strong. C-H. ERG staining in cancer foci in radical prostatectomy specimens. C-E. C (40×). Heterogeneous staining in a cribiform nodule of cancer (arrowhead). Note strong uniform staining in adjacent tumor nodule. D (100×) and E (400×) show heterogeneous staining with retained strong staining of endothelial cells (arrows). F-H. Cancers with weaker staining in center of tumor (arrowheads).

