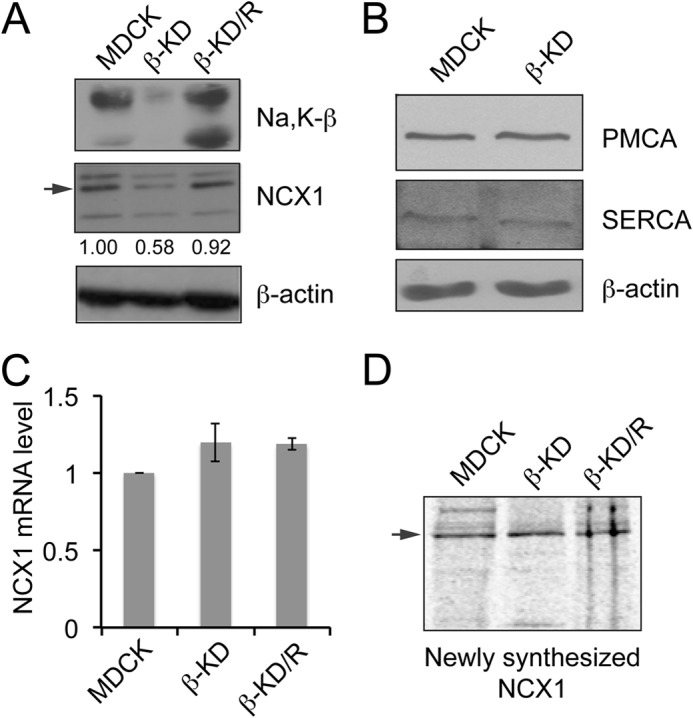
FIGURE 1.

Knockdown of Na,K-β reduces NCX1 expression in MDCK cells. A, immunoblots showing Na,K-β, NCX1 and β-actin levels in the indicated cell lines. The arrow indicates 120-kDa NCX1 full-length protein. The bands at 160 and 70 kDa represent non-reduced exchanger and proteolytic fragment of NCX1, respectively. Quantification of NCX1 levels from three independent experiments expressed as -fold change normalized to β-actin loading control are indicated below the blot. The reduction in NCX1 protein level in β-KD cells is statistically significant (p < 0.05). B, immunoblots showing PMCA4, SERCA2, and β-actin levels in MDCK and β-KD cells. C, graph showing NCX1 mRNA level in MDCK, β-KD, and β-KD/R cells quantitated by quantitative real-time PCR. Mean values from three independent experiments are plotted. Error bars denote S.E. (p = 0.247). D, cells were metabolically labeled with [35S]methionine. Cell lysates were immunoprecipitated using anti-NCX1 antibody and resolved by SDS-PAGE. The newly synthesized NCX1 was detected by fluorography.
