FIGURE 3.

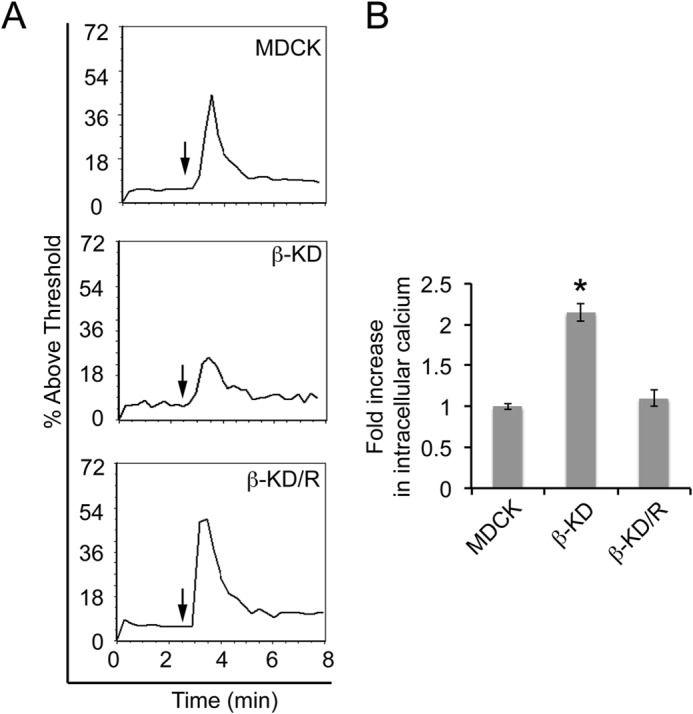
β-KD cells are ouabain-insensitive and have elevated baseline intracellular calcium due to reduced NCX1 levels. A, the plots show flow cytometric analysis of intracellular calcium in MDCK, β-KD, and β-KD/R cells. The data are represented as the percentage of fluorescence intensity above the threshold after the addition of 100 μm ouabain (arrow). Representative plots from three independent experiments in triplicate are shown. B, the graph shows -fold change in baseline intracellular calcium concentrations compared with MDCK cells. Average values from three independent experiments are plotted. Error bars denote S.E. The asterisk indicates statistical significance (*, p < 0.0001).
