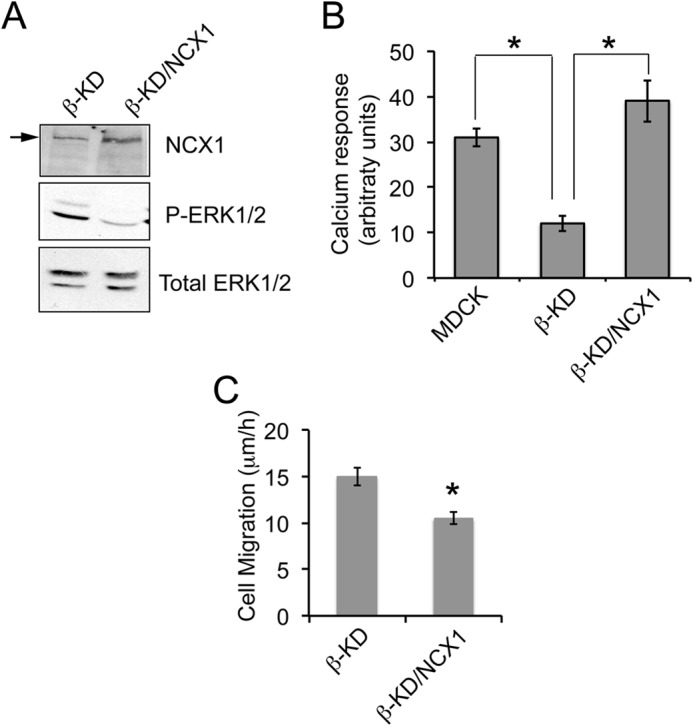
FIGURE 8.

Overexpression of NCX1 in β-KD cells reduces ERK1/2 phosphorylation, exhibits response to NCX1 inhibitor, and decreases migration rate. A, representative immunoblots showing NCX1, phosphorylated ERK1/2, and total ERK1/2 levels in the indicated cell lines. B, the graph represents the mean amplitude of calcium response after treatment with 10 μm KB-R7943 in MDCK, β-KD, and β-KD/NCX1 from at least 15 individual cells measured by confocal microscopy. Similar data were obtained in three independent experiments. Error bars denote S.E., and the asterisks indicate statistical significance (*, p < 0.05). C, the graph depicts the average rate of migration as determined by wound healing assay from three independent experiments in triplicate. Error bars denote S.E., and the asterisk indicates statistical significance (*, p < 0.05).
