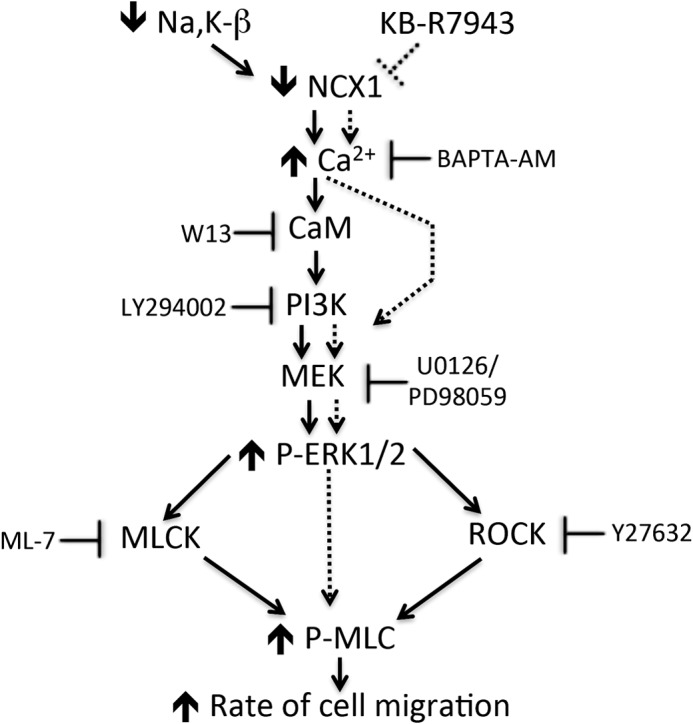
FIGURE 9.

Schematic model of regulation of migration by reduced protein expression or functional inhibition of NCX1 in renal epithelial cells. The solid arrows indicate the consequences of the reduction in the NCX1 protein level, whereas the dotted lines indicate the consequences of functional inhibition of NCX1. ROCK, Rho-associated protein kinase.
