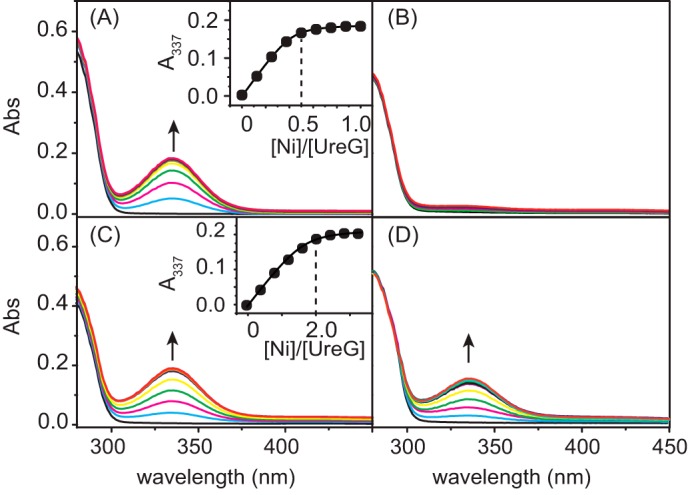
FIGURE 1.

Ni2+ binding to UreG monitored by UV-visible spectroscopy. A–D, Ni2+ was titrated into 20 μm apo-UreG in 20 mm Hepes, 100 mm NaCl, 500 μm TCEP, pH 7.2, with supplementation of 100 μm GTP, 1 mm Mg2+ (A), 100 μm GDP, 1 mm Mg2+ (B), only 100 μm GTP without Mg2+ (C), or 20 μm Zn2+, 100 μm GTP, and 1 mm Mg2+ (D). The titration curve plotted at 337 nm is shown in the inset. Abs, absorbance.
