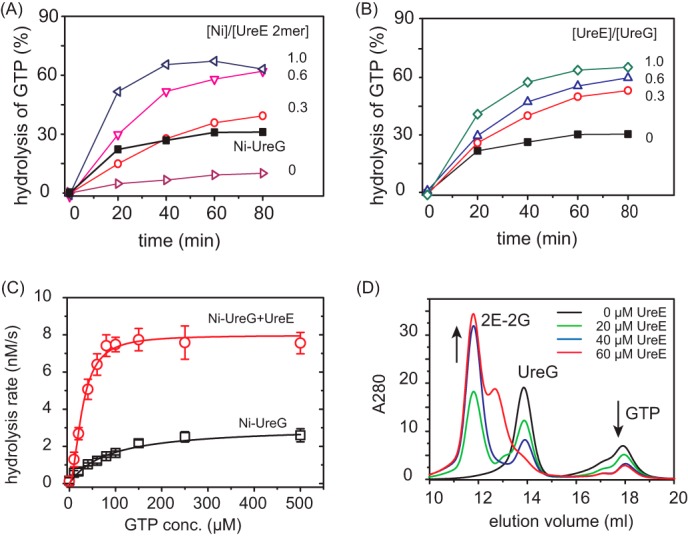
FIGURE 6.

Enhancement of GTPase activity of UreG by UreE. A, time dependence of GTPase activities of apo-UreG in the presence of 1 molar eq of UreE loaded with different amounts of Ni2+ (0-, 0.3-, 0.6-, and 1.0-fold). The black curve represents the GTPase activity of Ni-UreG. B, time dependence of GTPase activities of Ni-UreG in the presence of different amounts of apo-UreE (0-, 0.3-, 0.6-, and 1.0-fold). C, saturation curves of Ni-UreG in the absence and presence of equimolar amounts of apo-UreE. Km values are obtained by fitting the saturation curves to the Michaelis-Menten equation to be ∼82.7 × 10⁻⁶ m for Ni-UreG alone and 27.9 × 10⁻⁶ m for Ni-UreG and UreE mixture. GTPase assays were carried out in the presence of 10 mm KHCO3. GTP conc., GTP concentration. Error bars indicate means ± S.E. D, gel filtration chromatography profiles of UreG (∼40 μm) preincubated with different amounts of UreE (0, 20, 40, 60 μm) supplemented with ∼40 μm GTP and 1 mm MgSO4. The addition of UreE into UreG leads to the formation of 2E-2G complex, facilitating GTP binding.
