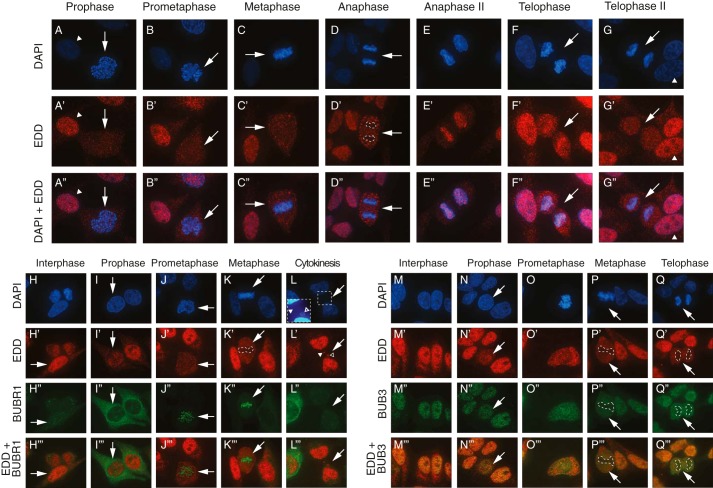
FIGURE 3.
EDD, BUBR1, and BUB3 immunofluorescence analysis during mitosis. A–Q”', asynchronous HeLa cells were fixed, stained with DAPI, and processed for immunofluorescence with the indicated primary antibodies. Interphase and distinct mitotic phase cells were determined by DAPI-based DNA staining, with the relevant cell of interest marked by an arrow. Overlays of DAPI + EDD (A”–G”), EDD + BUBR1 (H”'–L”'), and EDD + BUB3 (M”'–Q”') are also shown. Dashed lines indicate areas of low colocalization between the protein of interest (low signal) and DAPI staining (high signal). In A–G”, the EDD images are representative of at least >70% of the cells analyzed in each mitotic phase (prophase, 26 of 33; prometaphase, 7 of 7; metaphase, 26 of 31; anaphase, 4 of 4; anaphase II, 3 of 3; telophase, 14 of 14; telophase II, 5 of 7).

