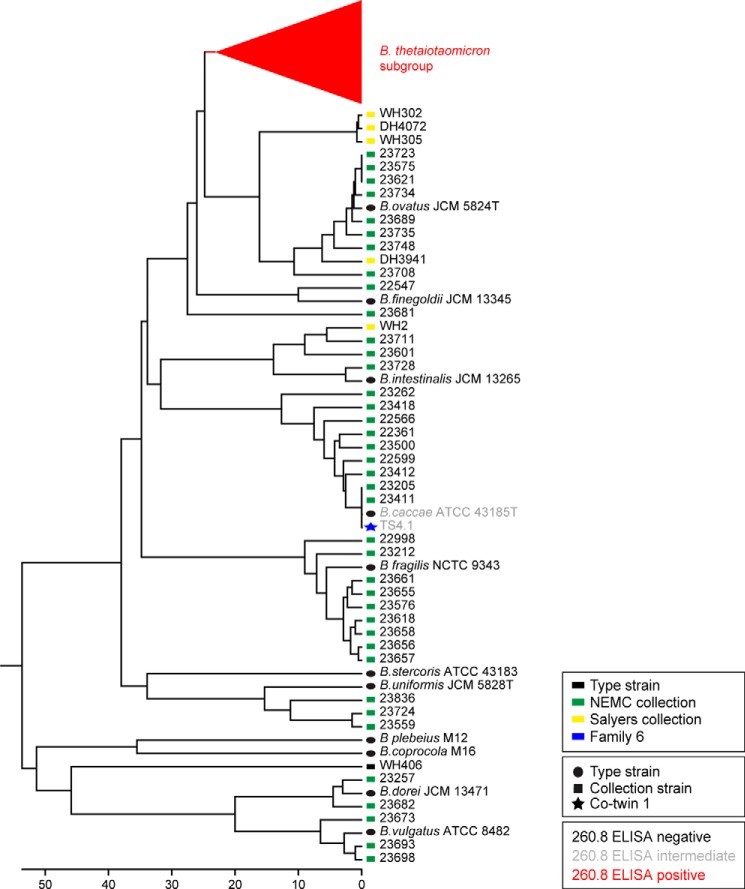
FIGURE 2.
16 S rRNA-based phylogenetic tree of human gut Bacteroides isolates and their reactivity with mAb 260.8 as measured by ELISA. Icons accompanying the isolate name are color-coded according to the source (i.e. type strain, culture collection, or the human family with twins from which the isolate was derived). Branch and text color reflect the ELISA reactivity.

