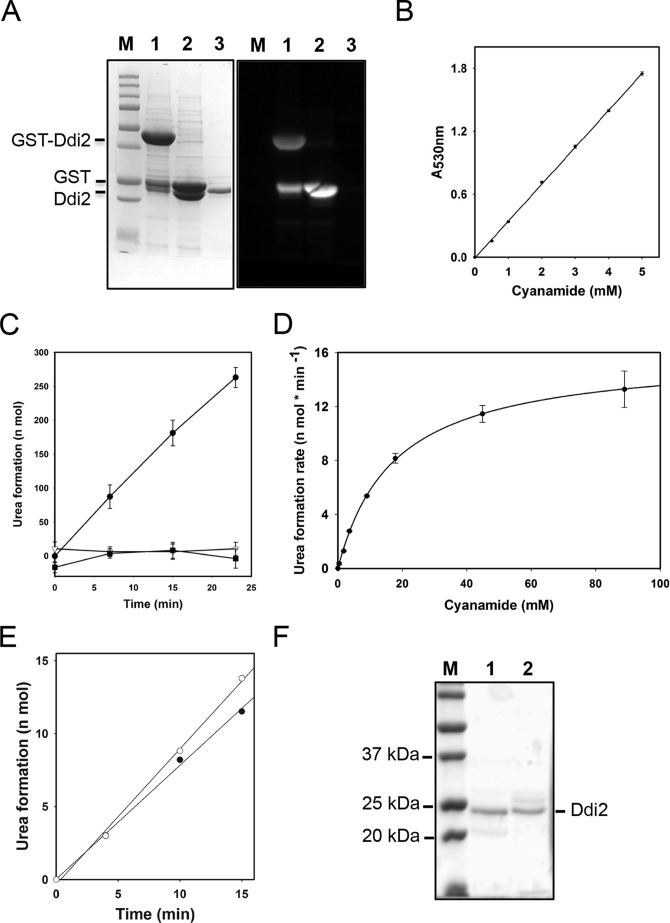
FIGURE 3.
Enzymatic characterization of the recombinant Ddi2 protein. A, SDS-polyacrylamide gel image and the corresponding anti-GST Western blot to show the purification of the recombinant Ddi2 protein. Lane M, Precision Plus ProteinTM unstained standards (from Bio-Rad); lane 1, purified GST-Ddi2; lane 2, GST-Ddi2 incubated with PreScission Protease for 16 h; lane 3, recombinant Ddi2 after removal of the GST tag, which was used in the enzymatic assay. B, colorimetric assays of cyanamide. The experiment protocol was modified from Refs. 29, 33. Linear regression was programmed by using SigmaPlot12. R2 = 0.99. C, time courses of urea formation of Ddi2 and site-specific double mutants. Each reaction contained 44.8 mm cyanamide and 0.027 μm wild-type Ddi2 or 0.39 μm mutant Ddi2. ●, wild-type Ddi2; ▾, Ddi2-H88AD89A; and ■, Ddi2-H137AD139A. Note that Ddi2-H137AD139A was not purified to the same extent as the WT and Ddi2-H88AD89A proteins. D, Michaelis-Menten curve of Ddi2 to cyanamide. 0.7 μg (27 nm) of Ddi2 was applied in the assay. The urea formation rates from 0.3 to 88 mm cyanamide were measured. Nonlinear regression was determined by the SigmaPlot 12 program with the Michaelis-Menten equation. E, time course monitoring of urea formation by Ddi2 and His6-tagged Ddi2 proteins. ○, Ddi2 protein purified from GST expression system, in which the GST tag was cleaved and removed. ●, C-terminal His6-tagged Ddi2, expressed from a pET28 vector. Applied proteins were 20 μg; cyanamide concentration was 0.15 mm. Linear regressions were programmed by using SigmaPlot12. R2 values of both trend lines are 0.997. F, SDS-polyacrylamide gel image showing the purified wild-type Ddi2 and its mutant derivative. Lane M, Precision Plus ProteinTM unstained standards; lane 1, purified Ddi2; lane 2, purified Ddi2-H88AD89A. Note that the purification resulted in a single intense band corresponding to Ddi2 plus additional minor bands.

