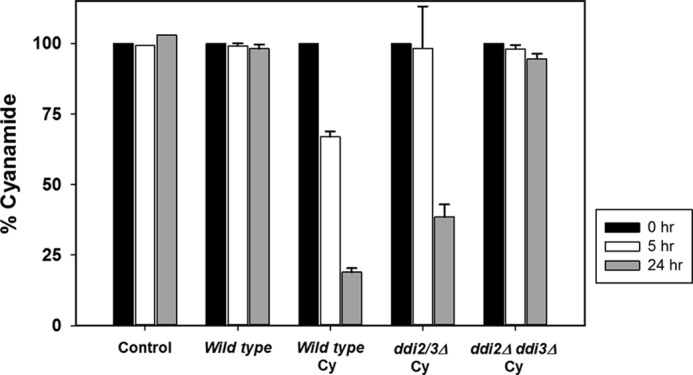
FIGURE 6.

Influence of yeast WCE on cyanamide metabolism. 2 mm cyanamide was either incubated in the reaction mixture alone (Control) or in the presence of WCE from 1) wild-type cells without prior cyanamide treatment; 2) wild-type cells induced by cyanamide (Cy); and 3) the ddi2Δ ddi3Δ mutant cells induced by cyanamide. The cyanamide concentration was measured by a colorimetric assay at A530 nm. The cyanamide concentration at time 0 (filled bars) is taken as 100%. Open bars, after a 5-h incubation; and gray bars, after a 24-h incubation. The results are the average of three independent experiments with standard deviation.
