
FIGURE 4.
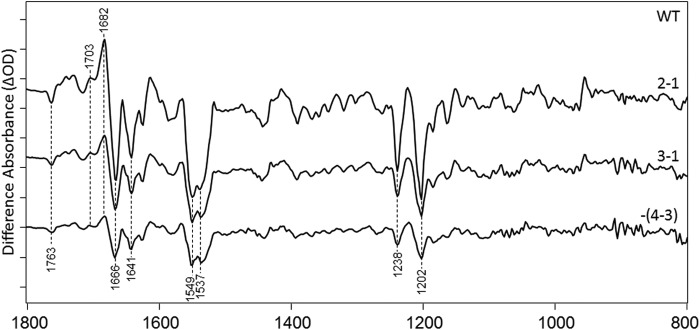
FTIR difference spectra in the 800–1800-cm−1 region of CaChR1 recorded using the photoreversal methods at 270 K (see “Experimental Procedures”). y axis markers are ∼0.2 mOD for all spectra.
Official websites use .gov
A
.gov website belongs to an official
government organization in the United States.
Secure .gov websites use HTTPS
A lock (
) or https:// means you've safely
connected to the .gov website. Share sensitive
information only on official, secure websites.
FTIR difference spectra in the 800–1800-cm−1 region of CaChR1 recorded using the photoreversal methods at 270 K (see “Experimental Procedures”). y axis markers are ∼0.2 mOD for all spectra.