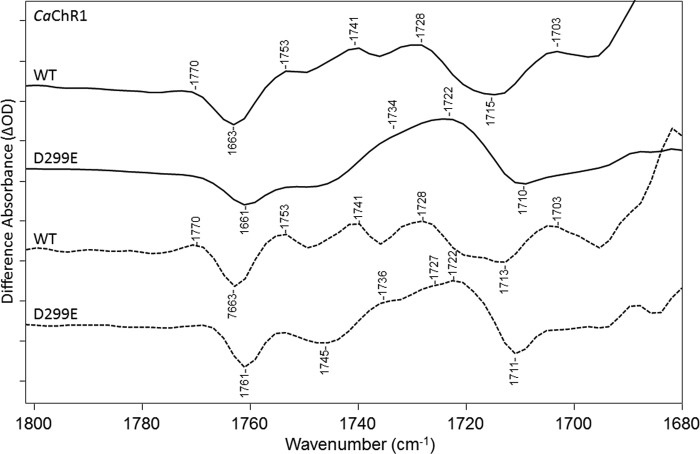
FIGURE 8.
FTIR difference spectra in the 1680–1800-cm−1 region of CaChR1 WT (first and third spectra) and the mutant D299E (second and fourth spectra) recorded at 270 K in H2O using methods identical to those described in the legend for Fig. 2. Dashed plots show FSD processed spectra as described under “Experimental Procedures.” y axis markers are ∼0.1 and 0.03 mOD for WT and D299E spectra, respectively.

