FIGURE 1.
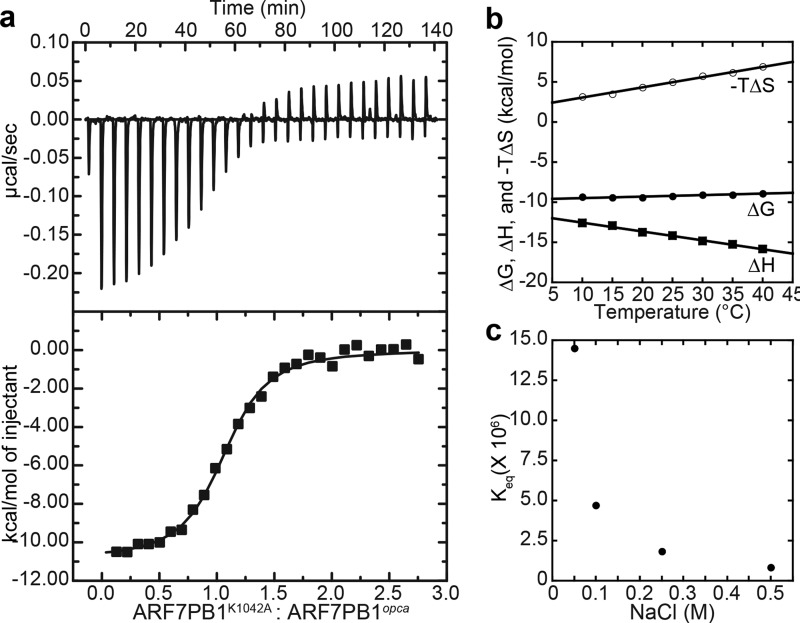
Thermodynamic analysis of ARF7 PB1 domain interaction. a, titration of ARF7PB1K1042A into ARF7PB1opca. The top panel shows the heat signal (μcal s−1) plotted versus time (min). The experiment consisted of 30 sequential injections of 10 μl of ARF7PB1K1042A (100 μm) into a cell solution of ARF7PB1opca (10 μm) at 25 °C. The bottom panel shows the integrated heat response per injection from the upper panel plotted as a function of moles of injectant. The solid line represents the fit of the data to a single-site binding model. b, temperature dependence of ΔH (squares), ΔG (open circles), and −TΔS (filled circles) determined by ITC for ARF7PB1 interaction. c, salt dependence of ARF7PB1 interaction. The Keq (1/Kd) values determined by ITC at varied NaCl concentrations are shown.

