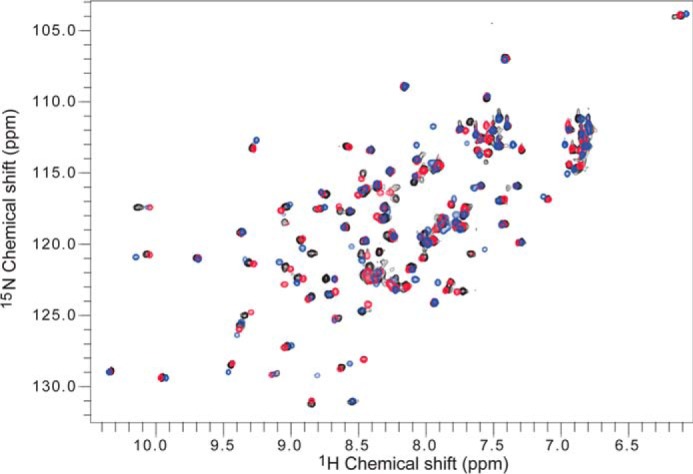
FIGURE 6.

Overlay of two-dimensional HSQC Spectra for ARF7PB1K1042A, ARF7PB1opca, and ARF7PB1K1042A,opca. The two-dimensional 1H,15N HSQC spectra were collected and subsequently overlaid using NMRView (30) for ARF7PB1K1042A (blue), ARF7PB1opca (red), and ARF7PB1K1042A,opca (black).
