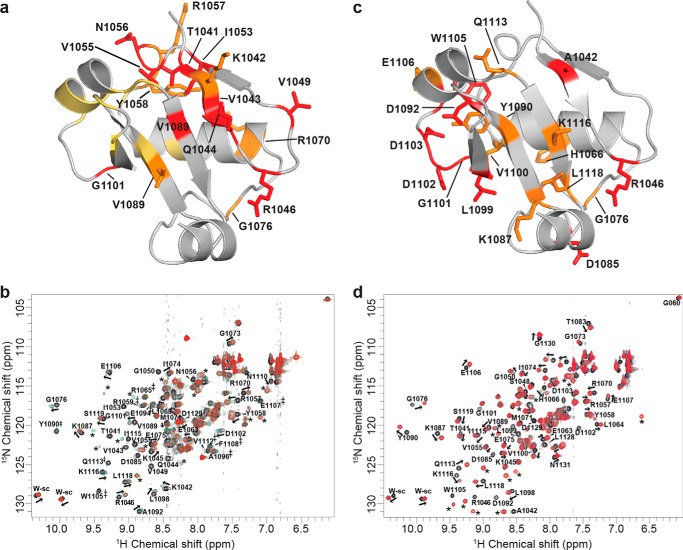
FIGURE 7.
Effects of ARF7 PB1 domain interaction on NMR peak shifts. a, the results of titrating unlabeled ARF7PB1K1042A into 15N-ARF7PB1opca are mapped onto a ribbon diagram of the ARF7 PB1 domain. Residues shaded red, yellow, and orange participate in slow, intermediate, and fast exchange, respectively. b, two-dimensional 1H,15N HSQC spectra show chemical shift data for the titration of unlabeled ARF7PB1K1042A into 15N-labeled ARF7PB1opca. Molar ratios of unlabeled ARF7PB1K1042A:15N-ARF7PB1opca are indicated by black (0:1), blue (1:1), green (2:1), and red (3:1) colors. Peaks that move upon titration are labeled with a residue number as well as an arrow displaying the direction of peak movement (fast exchange). Peaks that disappear upon titration are labeled with a residue number (slow exchange). Peaks that broaden upon titration (intermediate exchange) are labeled with a residue number and an asterisk (‡). New peaks that appear after titration and cannot be assigned to a residue are labeled with an *. These peaks correspond to the bound state for those residues that are in slow exchange. c, the results of titrating labeled ARF7PB1opca into 15N-ARF7PB1K1042A are mapped onto a ribbon diagram of the ARF7 PB1 domain. Residues shaded red and orange participate in slow and fast exchange, respectively. d, two-dimensional 1H,15N HSQC spectra show titration chemical shift data for the titration of unlabeled ARF7PB1opca into 15N-ARF7PB1K1042A. Molar ratios of unlabeled ARF7PB1opca:15N-ARF7PB1K1042A are indicated by black (0:1), blue (1:1), green (2:1), and red (3:1) colors. Labels and symbols are as in panel b.

