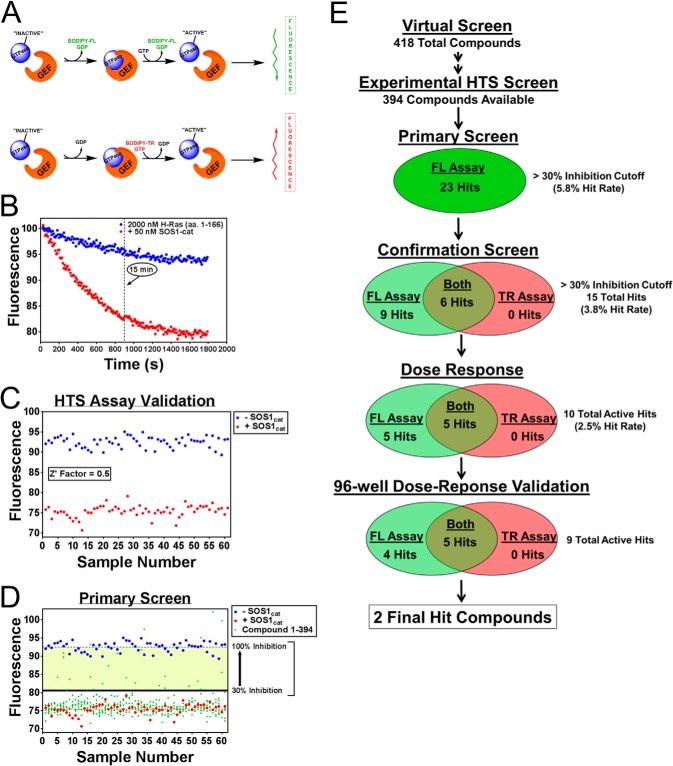
FIGURE 2.
High throughput screening platform for small molecule inhibitors of GEF catalytic activity. A, schematic of the methodology of the two complementary fluorescent (fluorescein and Texas Red) intensity guanine nucleotide exchange assays used for experimental screening. B, characterization of the BODIPY-FL-GDP dissociation primary screening assay. 50 nm purified His6-SOS1cat (red circle)-stimulated BODIPY-FL-GDP nucleotide exchange for unlabeled GTP on purified 2 μm His6-H-Ras (residues 1–166) (blue circle). C, validation of the GDP dissociation primary screening assay. −SOS1cat (blue circle) and +SOS1cat (red circle) controls from the primary screening assay plates are plotted using a 15-min time point and subsequently used to calculate the statistical coefficient, Z′-factor (22), to validate the assay for HTS. D, HTS results of the primary screen. −SOS1cat (blue circle) and +SOS1cat (red circle) DMSO controls along with the chemical compounds (green circle) tested for their ability to inhibit SOS1 catalytic activity are plotted using a 15-min time point. The >30% inhibition cutoff used is indicated. E, HTS platform experimental screening scheme used to identify inhibitors of SOS1 catalytic activity. 418 candidate compounds were identified from the virtual screen as described in Fig. 1. 394 of these 418 compounds were available for experimental screening. 23 of the 394 compounds were identified as hits from the primary screen. 15 of these 23 hits were confirmed using two complementary fluorescent intensity assays. Of these 15 hits, 10 hits were validated by a 10-point dose response (2-fold serial dilution; 0.195–100 μm), and subsequently 9 of these 10 hits were validated in 96-well format dose response (0, 2, 5, 10, 20, 50, and 100 μm). Five of the nine hits showed activity in both complementary fluorescent assays. Two of these five hits were selected for further validation and characterization. Data in B–D are expressed as percent change of fluorescence units normalized to the initial time point. Data in B were performed in triplicate. C, three outliers were removed from both the −SOS1cat and +SOS1cat control datasets based upon visual inspection.

