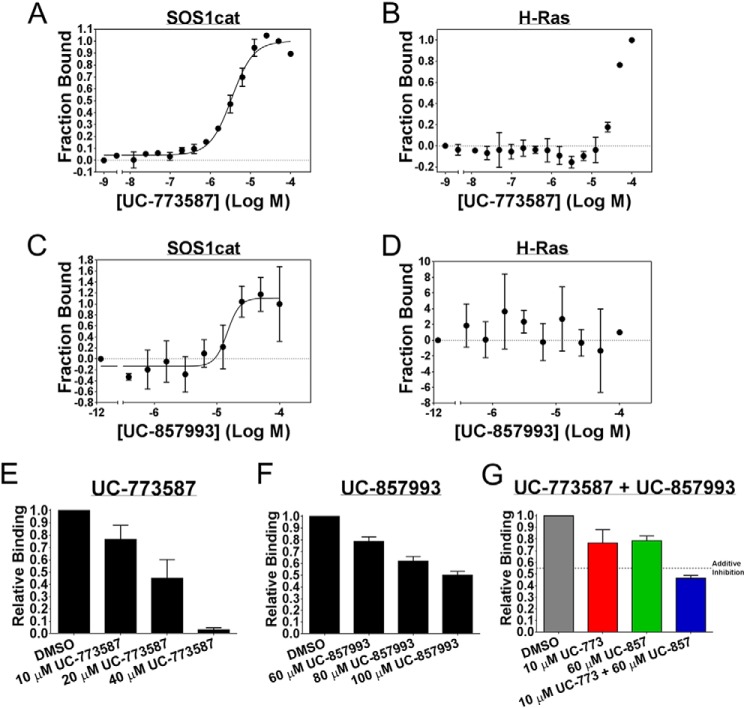
FIGURE 5.
UC-773587 and UC-857993 selectively bind to SOS1 and disrupt the interaction between SOS1 and H-Ras. Direct binding of UC-773587 and UC-857993 to His6-SOS1cat or to His6-H-Ras (residues 1–166) as measured by microscale thermophoresis. A and C, 0 to 100 μm UC-773587 or UC-857993 was titrated to a constant amount of NT-647-labeled His6-SOS1cat (100 nm). UC-773587 and UC-857993 bound His6-SOS1cat with Kd values of −5.469 ± 0.02533 log M (3.4 μm) and −4.833 ± 0.09217 log M (14.7 μm), respectively. B and D, 0 to 100 μm of UC-773587 or UC-857993 was titrated to a constant amount of NT-647-labeled His6-H-Ras (100 nm) resulting in no binding. Competition of His6-H-Ras (residues 1–166) binding to NT-647-labeled His6-SOS1cat (50 nm) is shown. UC-773587 (E) and UC-857993 (F) dose-dependently inhibited titration of His6-H-Ras (amino acids 1–166) (0.2–100 μm) binding to NT-647 cysteine-labeled His6-SOS1cat (50 nm) at the indicated compound concentrations as expressed by the bar graphs. G, UC-773587 (10 μm) and UC-857993 (60 μm) additively inhibited titration of His6-H-Ras (amino acids 1–166) (0.2–100 μm) binding to NT-647 cysteine-labeled His6-SOS1cat (50 nm) as expressed by the bar graph. Dissociation constants (Kd) in A and C were determined using nonlinear regression (GraphPad Prism 6, La Jolla, CA). Data in E–G are expressed as relative binding and represent normalized binding values to the DMSO control at a nonsaturating concentration H-Ras (12.5 μm). Data in all panels represent the mean ± S.E. of three independent experiments.

