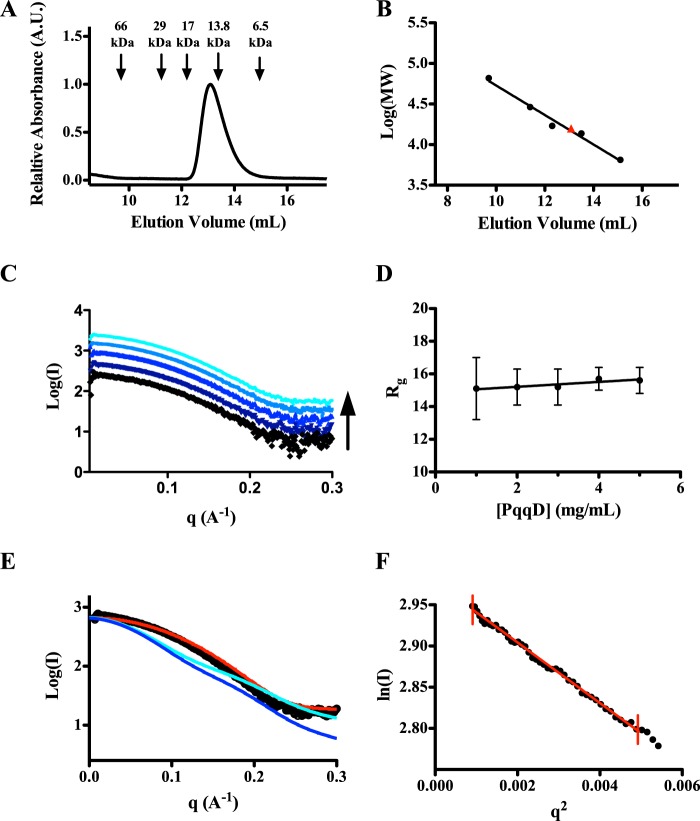
FIGURE 3.
SEC and SAXS analysis of KpPqqD. A, the analytical size exclusion chromatogram of purified KpPqqD monitoring tryptophan absorbance at 280 nm shows a single peak with an elution volume that corresponds to a 14.9-kDa protein, calculated from the standard curve in B. B, the standard curve of the molecular weight standards shows a linear relationship with elution volume (black points and line). The calculated molecular weight for KpPqqD is shown by the red triangle. C, the similarity of the SAXS profiles for KpPqqD at all concentrations studied (1, 2, 3, 4, and 5 mg/ml: black, violet, dark blue, blue, and cyan, respectively) is independent of protein concentration. D, the plot of the radius of gyration as a function of KpPqqD shows its independence of protein concentration. E, experimental SAXS profile of KpPqqD (○) does not agree with the XcPqqD SAXS profiles calculated from the dimer (cyan line) or monomer (blue line) crystal structures. However, the SAXS profile for KpPqqD does agree with the compact model of XcPqqD (red line), constructed as described in the text and illustrated in Fig. 4B. F, the Guinier plot shows the linearity of the low q region of the experimental KpPqqD SAXS data extrapolated to zero scattering angle (red line), indicating that the protein has not aggregated.

