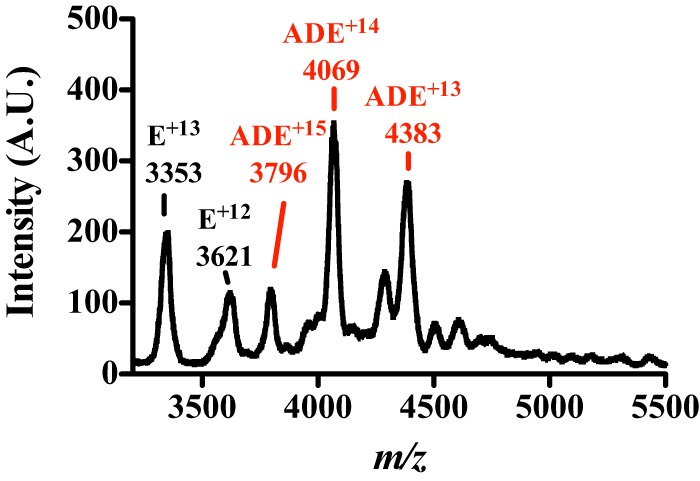
FIGURE 7.

Nano-Q-TOF-ESI-MS characterization of the MePqqA-MePqqD-MePqqE complex. The native mass spectrum of a solution containing 50 μm MePqqA, 50 μm MePqqD, and 10 μm MePqqE shows two sets of charge state distributions. The 12–13+ charged 43.6 kDa ions correspond to the MePqqE monomer and the new 13–15+ charged 57.0 kDa ions correspond to a ternary 1:1:1 MePqqA-MePqqD-MePqqE complex.
