FIGURE 4.
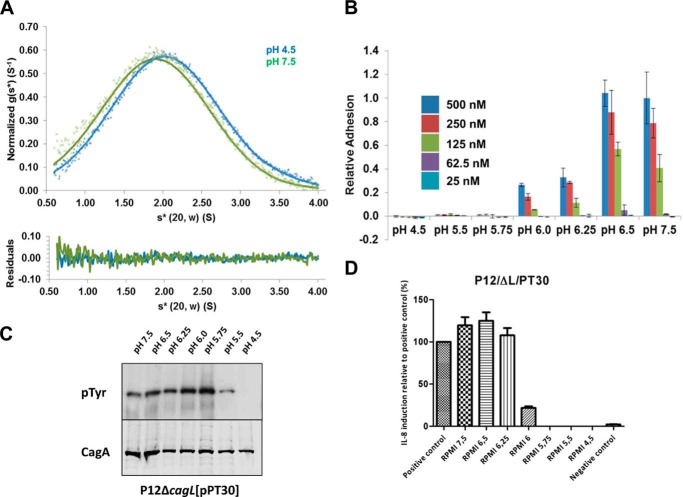
The large conformational change of CagL is not responsible for integrin binding. A, top, sedimentation velocity experiment of CagLL156/F204C (10 μm) at 50,000 rpm in 50 mm sodium acetate, 150 mm sodium chloride, pH 4.5 (blue crosses), or 50 mm Tris, 150 mm sodium chloride, pH 7.5 (green crosses). Fitted data are shown as solid lines and the residuals (bottom) are plotted. CagLL156/F204C sediments with an s20,w* of 2.1 and 2.0 for pH 4.5 and 7.5, respectively. B, relative adhesion of AGS cells to CagLL156/F204C were measured using the same assay. Data were normalized to 500 nm CagLWT, pH 7.5, with standard deviations displayed. C, translocation of CagA monitored by its phosphorylation at various pH values by CagLL156/F204C. D, relative induction of IL-8 secretion as measured by ELISA at various pH values by CagLL156/F204C. Data were normalized to a positive control.

