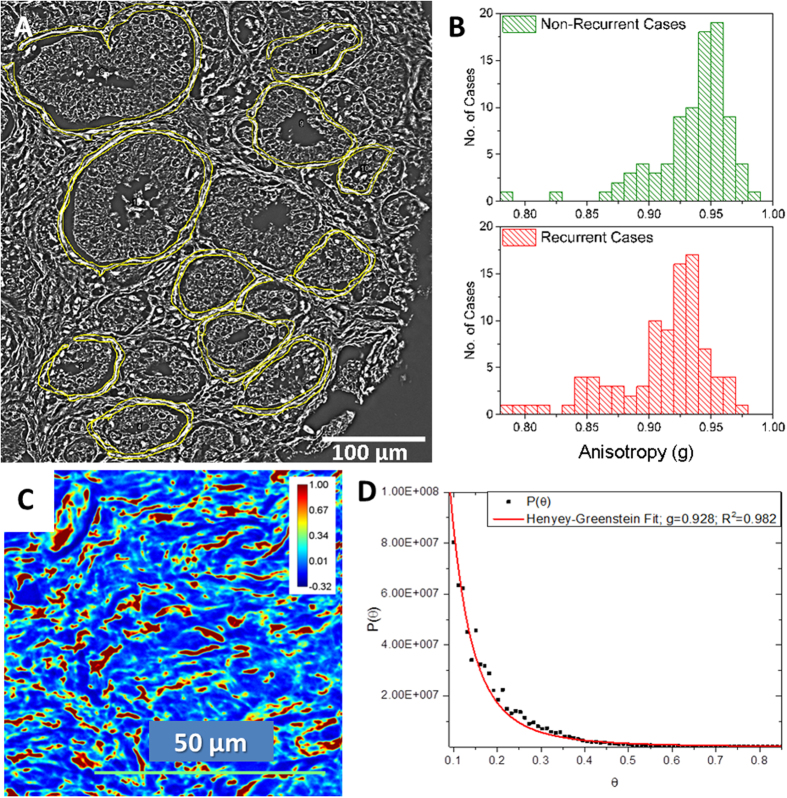
Figure 4. Optical Anisotropy Calculation.
(A) Optical anisotropy (g) was calculated in the single layer of stroma immediately adjoining multiple glands in each core. (B) The histograms show the distribution of anisotropy values among the 89 non-recurrent and 92 recurrent cases. The bin-size on the histogram was set at 0.01. (C) SLIM image of a stromal tissue region in the prostate imaged using the 40X/0.75NA objective. Optical anisotropy value calculated using the scattering phase theorem in this tissue region was g = 0.932. (D) Anisotropy calculation using Henyey-Greenstein phase function fit of the scattering angular distribution yields g = 0.928.

