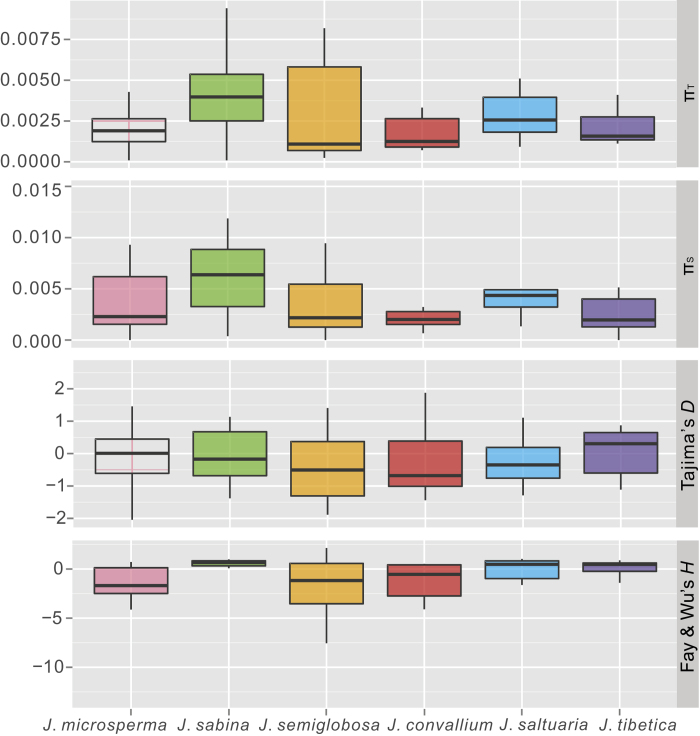
Figure 2.
Box plots of the summary statistics for Juniperus microsperma, J. sabina, J. semiglobosa and the J. tibetica complex (J. convallium, J. saltuaria and J. tibetica). Bars represent the median values, boxes represent the interquartile ranges and whiskers extend to 1.5 times of each interquartile range.

