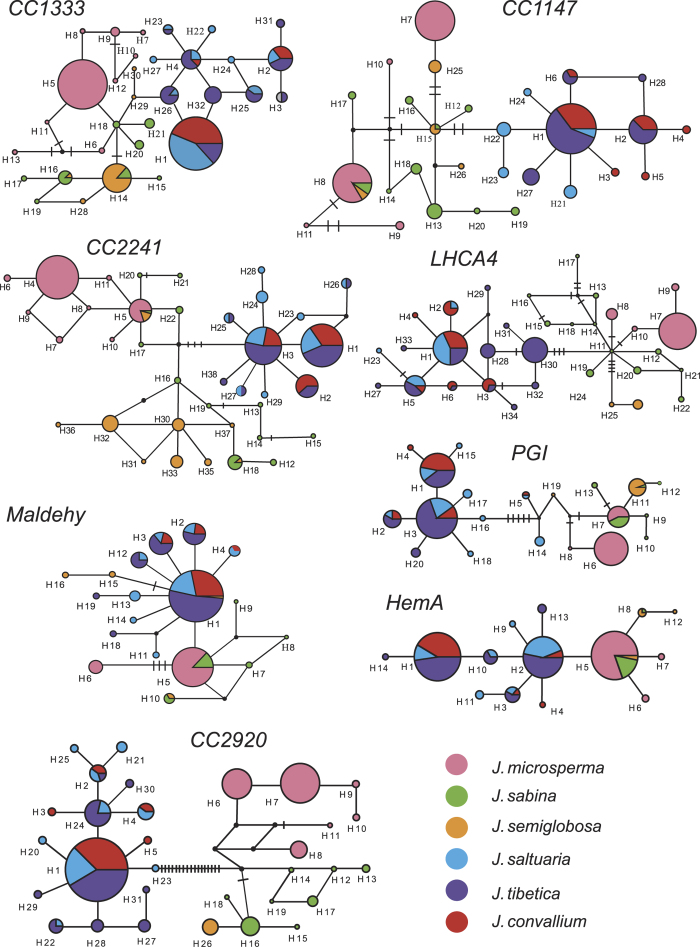
Figure 3.
Networks for all detected haplotypes at each of the eight nuclear loci. Each circle represents a haplotype, and each color represents a species; the size of each circle is proportional to the sample size of each population; and in each circle that comprises more than one species, the area of each color is proportional to number of individuals attributed to each species. The black circles represent missing haplotypes, and mutational steps are the black bars.

